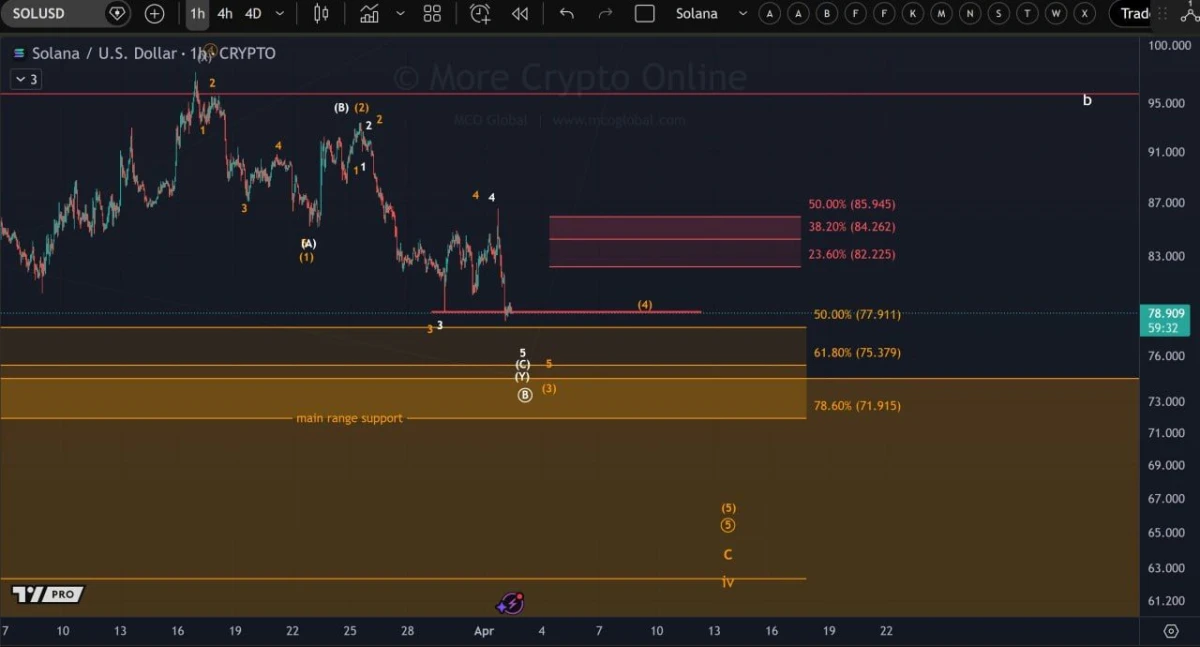
Solana / U.S. Dollar 1H Price Structure.Source: More Crypto Online on X
The main short term focus now sits on the next recovery attempt. According to the chart, the first notable resistance zone stands between $82.22 and $85.94. That range includes several Fibonacci levels marked at 23.6%, 38.2%, and 50.0%. As a result, any rebound into that area could face selling pressure if buyers fail to regain control.
At the same time, the chart shows Solana trading close to a lower support area around $77.91. Below that, the next marked downside levels appear near $75.37 and $71.91. The broader shaded support zone on the chart stretches lower, which suggests the analyst still sees room for price to test deeper levels if the current floor breaks.
The wave labels on the chart also show that the market structure remains incomplete. That matters because the analyst is watching whether the next bounce develops as a corrective move or a stronger impulsive move. In simple terms, a corrective bounce would likely mean only temporary relief before another leg lower. An impulsive recovery, however, could signal that sellers are losing control and that the structure is starting to shift.
For now, the chart does not show that shift yet. Instead, it shows a market still moving lower after repeated failed recoveries. Therefore, the next reaction around the $82.22 to $85.94 resistance band may become the key test for Solana’s short term direction. Until then, the tone of the setup remains cautious, with downside pressure still leading the structure shown on the chart.
Solana Chart Shows Tight Range as Momentum Stays Weak
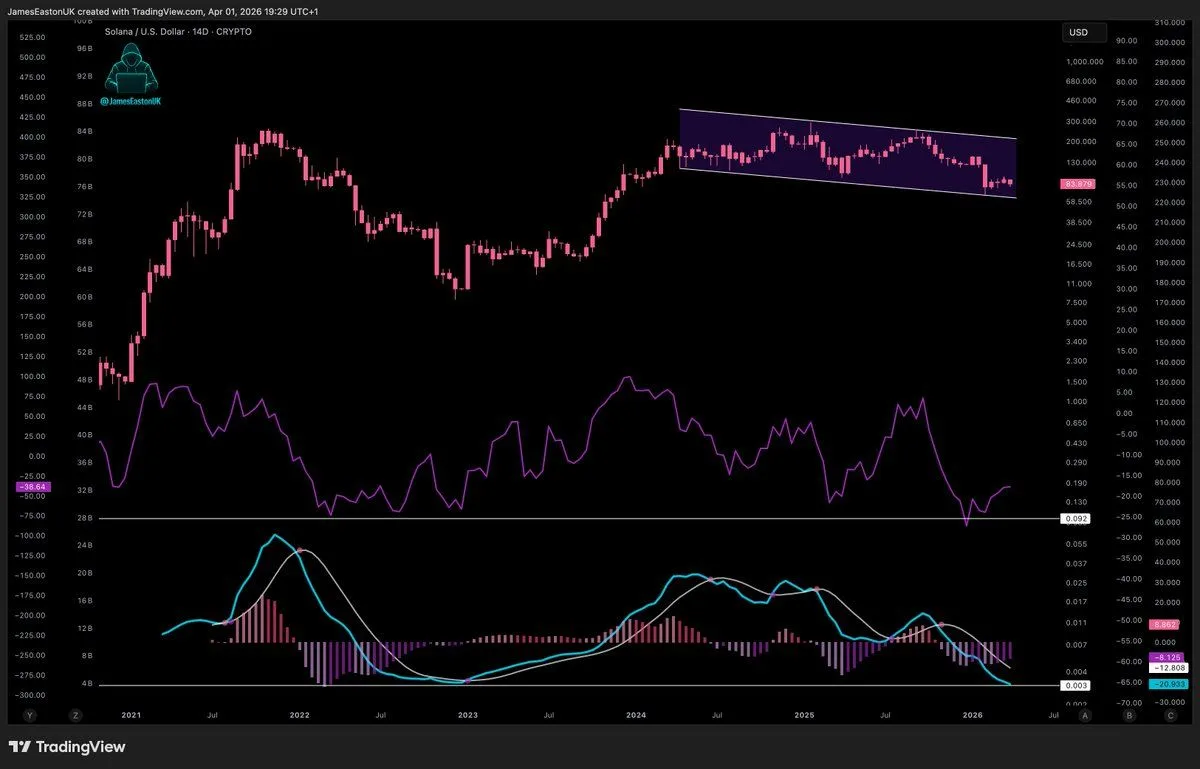
The Solana 14 day chart shared by James Easton presents a market that has moved into a narrowing downward channel after a long advance. The setup suggests consolidation, but the slope of that range still points lower. Price action inside the purple band has made a series of lower highs and lower lows, which usually reflects fading strength rather than a fresh breakout attempt.
Solana / U.S. Dollar 14D Price Structure: Source: JamesEastonUK on X
The structure matters more than any single candle here. Solana climbed sharply in earlier phases of the chart, then shifted into a broad sideways to downward pattern. Since the peak shown in late 2024 to early 2025, the chart has stopped trending higher and started moving within a controlled descending path. That usually means buyers are still active, but they are no longer in full control.
The indicators under the chart also lean weak. The upper momentum line has started to turn up from a depressed area, which may hint at a possible short term rebound. However, it still sits in a low zone, so the signal remains early and unconfirmed. At the same time, the lower indicator panel shows negative histogram bars and bearish separation in the moving lines. That combination suggests downside momentum has not fully cleared.
Taken together, the chart shows a market trying to stabilize, not one that has clearly reversed. The descending channel remains the main pattern to watch. If Solana keeps trading inside that range, the broader tone stays cautious. For sentiment to improve, the chart would need a stronger move through the upper boundary of the channel, backed by firmer momentum signals.
For now, the image supports a simple reading. Solana still looks technically heavy on this timeframe, even if momentum is trying to recover from weak levels.

 coinpaper.com