
Ripple ($XRP) is trading near $1.30 at the time of writing on Thursday, as Iran's war-driven sentiment weighs on risk assets. $XRP’s attempt to regain momentum this week stalled near $1.37 on Monday, reflecting risk-off sentiment amid capital exiting digital investment products.
$XRP wobbles on fading on-chain activity, institutional interest
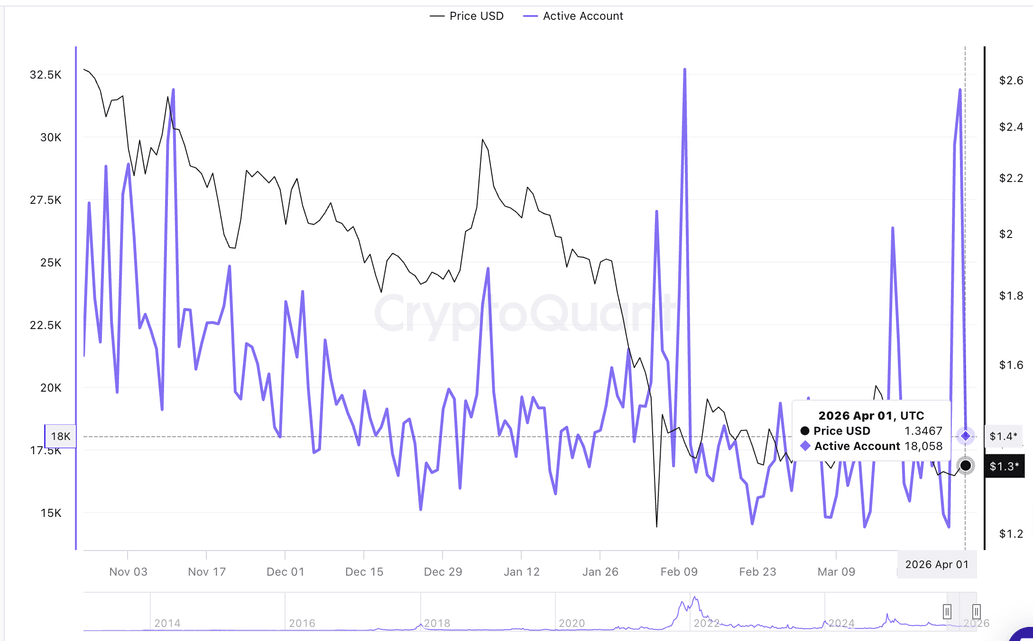
The number of active addresses transacting on the $XRP Ledger (XRPL) dropped by nearly 42% to around 18,000 on Wednesday, from nearly 32,000 on Tuesday, suggesting volatile activity amid the war in the Middle East, which has continued to pressure risk assets.
The CryptoQuant chart below suggests that demand for $XRP has remained subdued since early February, apart from a few isolated spikes in active addresses. Without steady user engagement, buying pressure narrows, weakening momentum.
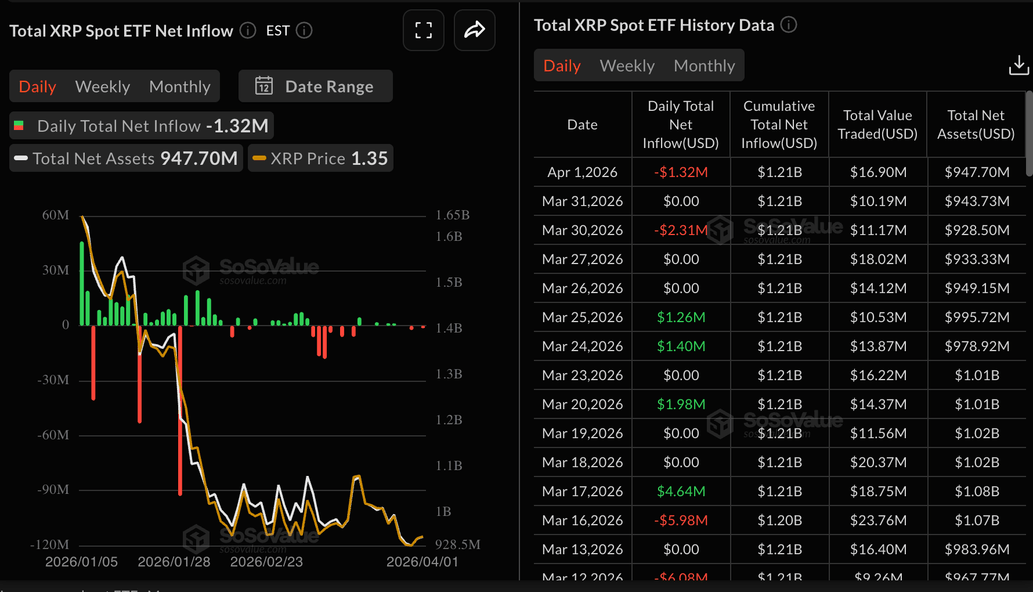
Interest in $XRP Exchange-Traded Funds (ETFs) has deteriorated further, as evidenced by mild outflows of $1.32 million on Wednesday following muted activity on Tuesday. $XRP ETFs also recorded outflows of roughly $2.3 million on Monday, undermining risk appetite.
If outflows persist, they would suggest that sentiment is deteriorating, limiting $XRP’s potential recovery.
Technical outlook: $XRP risks extending sell-off below $1.30
$XRP edges lower near $1.30 amid a dominant near-term bearish bias, as the price extends its slide below the descending resistance trendline. The remittance token is holding below the 50-day Exponential Moving Average (EMA) that sits near $1.44. At the same time, the 100-day and 200-day EMAs near $1.61 and $1.89 remain well above spot, reinforcing a broader downside context.
The Moving Average Convergence Divergence (MACD) indicator is below its signal line on the daily chart and has slipped into negative territory, with mildly expanding bearish histogram bars, suggesting selling pressure persists. Moreover, the Relative Strength Index (RSI) near 38 remains below the 50 mark on the same chart, suggesting weakening momentum rather than oversold conditions.
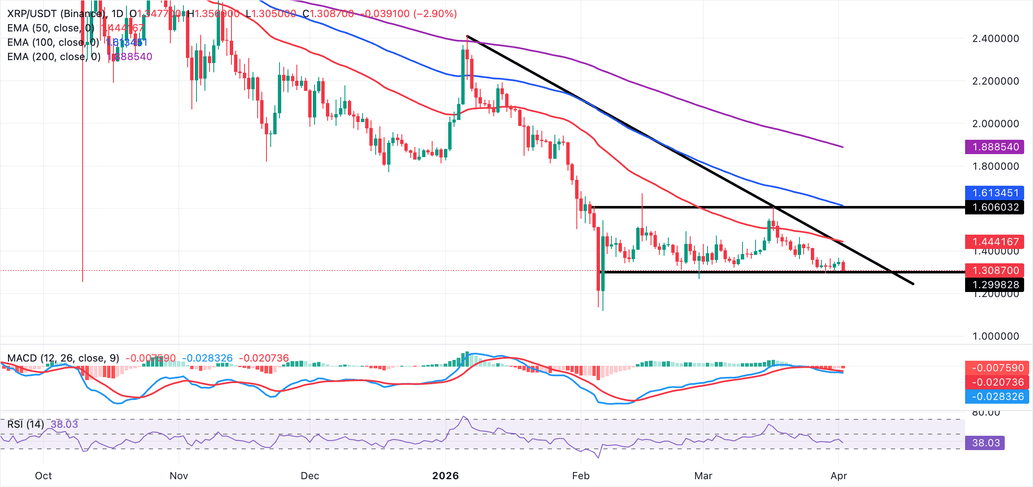
$XRP's immediate support lies at the recent low around $1.30, and a decisive break below this area would expose the next downside levels at $1.27 and then $1.25. On the topside, initial resistance aligns with the prior breakdown zone near $1.36, where recent candles stalled, followed by the $1.41–$1.42 band. A recovery above $1.42 would be needed to ease the current bearish pressure and open a move back toward the 50-day EMA around 1.44, where a denser resistance zone is expected to cap first attempts higher.
(The technical analysis of this story was written with the help of an AI tool.)