
Shiba Inu is gearing up for a decisive directional move as the Bollinger Bands tightens, but the direction remains a key topic of discussion.
In the past 24 hours, $SHIB has dropped 2.5%. Its downward move is not isolated—it follows the lead of the crypto leader, Bitcoin, which fell amid uncertainty following US President Donald Trump’s speech on the Iran conflict.
Before the retracement, Shiba Inu was showing promising signs. Despite pulling back considerably yesterday, it still ended up with a green candle, but with a slight increase. The Wednesday closing was its third straight positive closing until the macro factor clamped down on bullish prospects.
Key Points
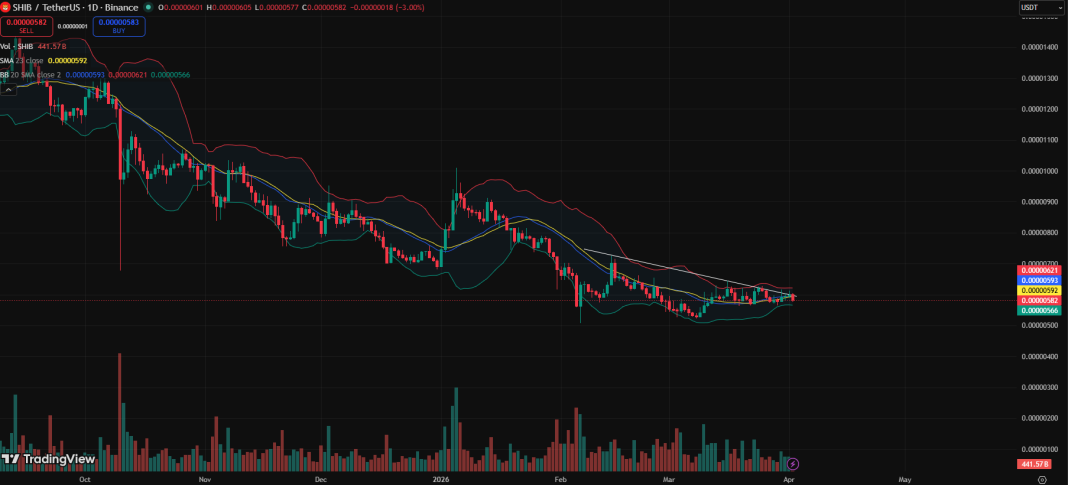
- On the daily chart, Shiba Inu has witnessed an obvious Bollinger Bands tightening.
- Typically, when the Bollinger Bands tighten, it indicates that volatility has been compressed, which precedes a breakout.
- The tighter and longer the Bollinger Bands, the stronger the subsequent breakout.
- Volume remains modest, so any move outside the Bollinger Bands under these circumstances could be a false alarm.
Shiba Inu Major Move on the Horizon
Notably, the momentum for a decisive directional move is building up for Shiba Inu, according to signs provided by the Bollinger Bands. On the daily chart, there has been an obvious tightening of the band, hinting that a breakout is on the horizon.
The analytical tool, developed by John Bollinger, consists of an upper, middle, and lower band. Technical analysts usually employ the indicator to measure volatility and identify whether an asset is overbought or oversold.
Typically, when the Bollinger Bands tightens, it indicates that volatility has reduced. Such conditions usually precede a breakout and the formation of a new price trend. Notably, these conditions align with developments on the $SHIB/USD daily chart.
The bands have continued to tighten compared to the width seen earlier in the year. In addition, Shiba Inu has also consolidated, shuffling between $0.0000066 and $0.0000052 since early February. The aligning trend suggests $SHIB is building momentum for a decisive breakout.
The Longer the Better
Meanwhile, the tighter the Bollinger Bands, the stronger the subsequent breakout. The duration of this compression also plays a key role. The longer this tightening goes on, the bigger the move that would follow. Interestingly, the bands has been compressing for several weeks now, making the impending break more intriguing.
However, a true breakout usually needs strong volume. If market activity does not tick up, any move outside the Bollinger Bands could be a false alarm. In the meantime, trading volume is still modest.
Key Shiba Inu Technical Levels to Watch
Technically, Shiba Inu is holding above the $0.0000052 support, which is a good base for any bullish price action. Recently, the token cleanly broke out of a “counter trendline” on the daily chart before the recent consolidation.
The next area of interest for $SHIB is the $0.00000616-$0.00000640 horizontal resistance band. Further upside momentum would take the token to a descending trendline near $0.0000070.
However, breaking below the $0.0000052 support could increase selling pressure, with the local demand zone at $0.0000050 the next key area.