$SHIB opens April at $0.0000060, up 1.5%, inside a descending channel that has been intact since September 2025. The daily chart shows all four EMAs declining overhead and the SAR at $0.0000630 capping recoveries, but the 30-minute chart has formed a symmetrical triangle with a fresh MACD bullish cross this morning.
$SHIB Daily Chart: Seven-Month Channel Narrows Toward A Decision
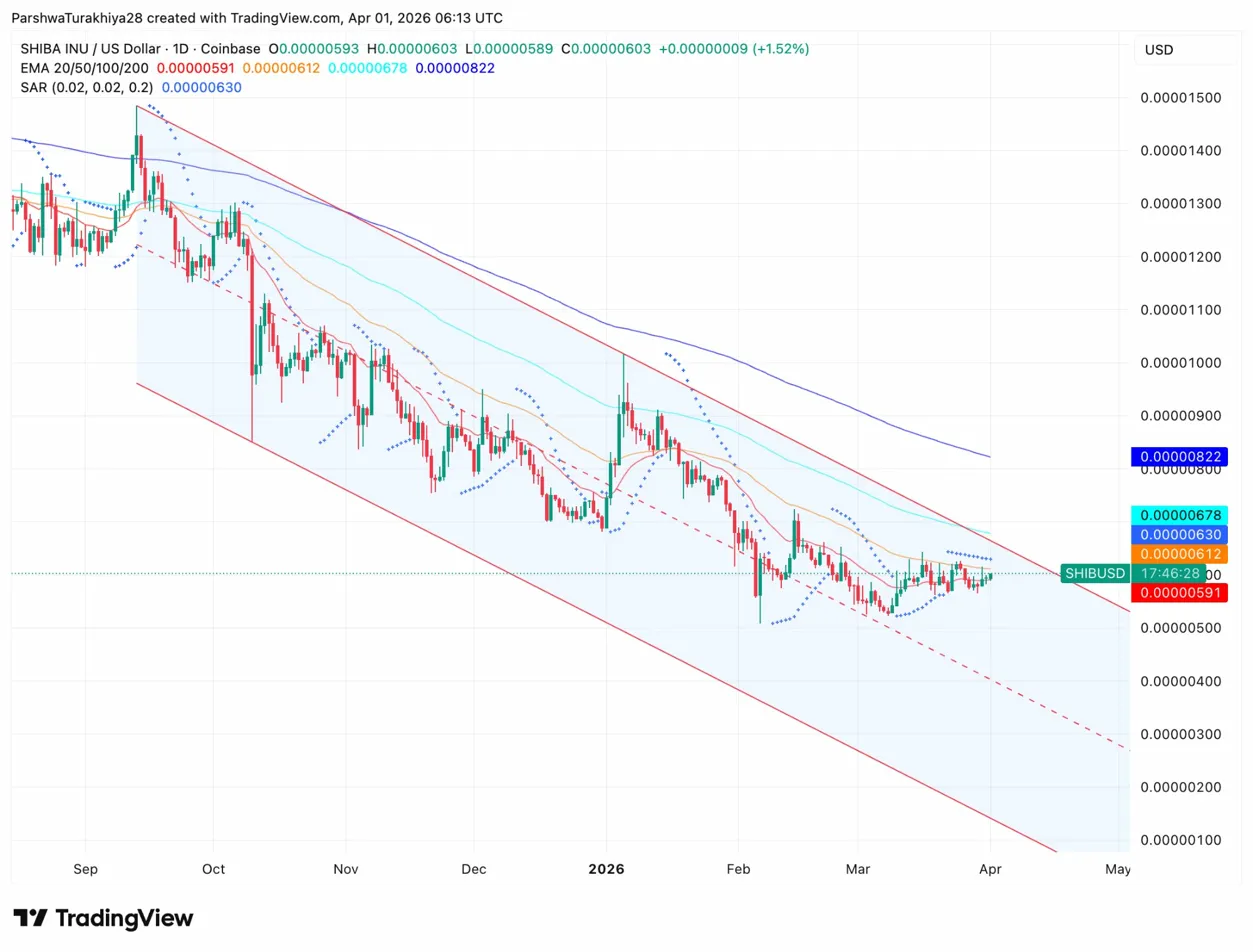
The descending channel that began at the September peak near $0.000015 has been compressing price steadily lower. The upper boundary sits near $0.0000075 and the lower boundary is approaching $0.0000040 through April at the current slope. Price has been hugging the lower half of the channel since February, and the four EMAs are all declining overhead: the 20-day at $0.0000591, the 50-day at $0.0000612, the 100-day at $0.0000678, and the 200-day at $0.0000822.
The SAR at $0.0000630 has been bearish since October without flipping. A daily close above $0.0000630 would be the first SAR flip in six months and the clearest signal that the channel’s grip is weakening. Until that happens, every rally remains a lower high within the channel structure. The 20-day EMA at $0.0000591 is the minimum reclaim needed to shift near-term structure from bearish to neutral.
| Level | Value | Role |
| 20-day EMA | $0.0000591 | First resistance |
| SAR resistance | $0.0000630 | Key breakout level |
| 50-day EMA | $0.0000612 | Next resistance |
| Channel upper boundary | $0.0000750 | April upside target |
| Channel lower boundary | $0.0000400 | April downside floor |
| 200-day EMA | $0.0000822 | Macro resistance |
Symmetrical Triangle Forms On The 30-Minute Chart
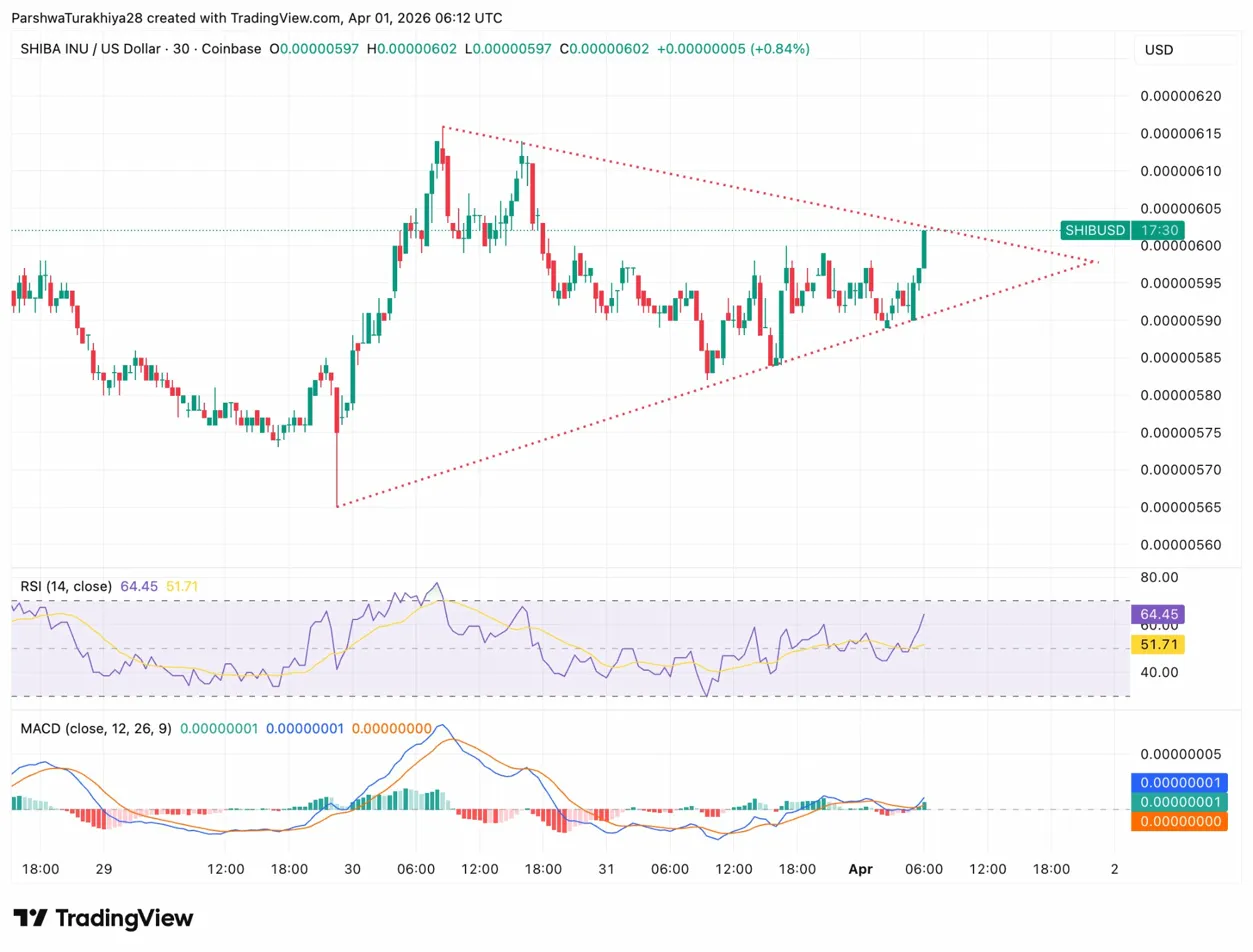
The 30-minute chart shows a symmetrical triangle forming since the March 30 high at $0.0000615. The upper boundary is sloping down from that high and the lower boundary is rising from the March 31 low near $0.0000585, with both lines converging at approximately $0.0000600 to $0.0000603 where price is currently pressing.
RSI reads 64.45 on the 30-minute with the signal line at 51.71, both rising and the RSI line well above the signal, confirming momentum is building rather than fading. The MACD shows a fresh bullish cross with both lines above zero and the histogram turning green. These are the clearest short-term momentum signals $SHIB has printed in days. A 30-minute close above the triangle’s upper boundary at $0.0000603 to $0.0000605 would confirm the breakout and target $0.0000632 as the measured move.
Key levels:
- Triangle upper boundary: $0.0000603 to $0.0000605
- Triangle lower boundary: $0.0000590 to $0.0000593
- Breakout target: $0.0000632
- Invalidation below: $0.0000585
$SHIB Derivatives: Volume Drops But Shorts Are Getting Squeezed
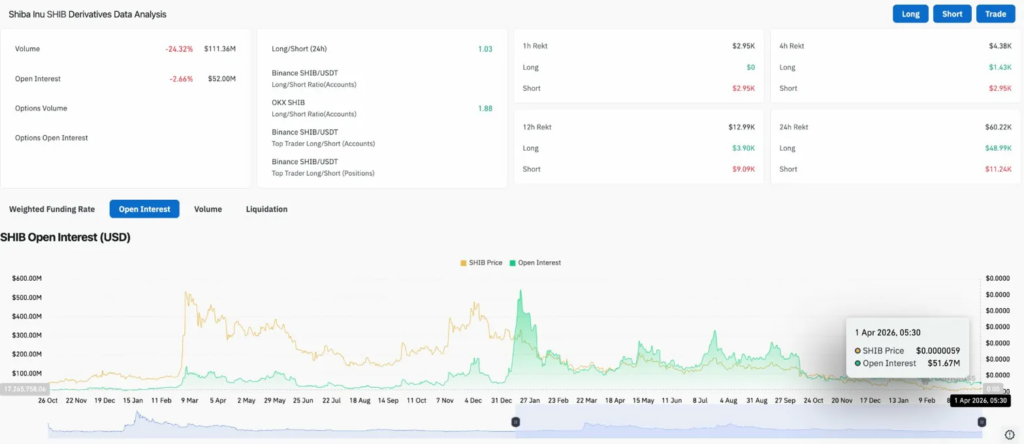
Futures volume fell 24.32% to $111.36M and OI dropped 2.66% to $52M, both declining together, meaning traders are reducing exposure rather than building positions. The 24h long/short ratio sits at 1.03, nearly balanced, with OKX accounts leaning slightly bullish at 1.88.
The liquidation data is the more interesting read. Over 24 hours, $48.99K in longs were cleared against $11.24K in shorts, but zooming into the 4-hour window, longs absorbed just $1.43K while shorts took $2.95K. The short-term shift toward short liquidations aligns with the morning triangle breakout attempt on the 30-minute chart. OI at $51.67M is well below the $500M peak from January, meaning leverage can build quickly if price sustains above $0.0000630.
Burn Rate Tracker Offline: What It Means For April
Shibburn, the primary tracker for $SHIB token burns, is currently experiencing technical issues and potential maintenance, leading to discrepancies in reported burn rates.
With the burn data unreliable for now, the supply-side narrative that has supported recent $SHIB rallies cannot be verified independently. Until Shibburn restores accurate tracking, burn rate should not be used as a price catalyst argument for April.
$SHIB Price Prediction: April Upside And Downside
- Upside: Close above the SAR at $0.0000630 on the daily and the channel structure begins to shift for the first time since October. The 30-minute triangle breakout targets $0.0000632, which aligns with that SAR level exactly. A sustained hold above $0.0000630 opens the channel midline near $0.0000750 as the April target.
- Downside: Lose the triangle’s lower boundary at $0.0000585 and the 30-minute setup fails. A daily close below the 20-day EMA at $0.0000591 keeps the channel intact and the lower boundary near $0.0000400 remains the path if selling resumes through April. With volume declining and OI falling, a breakdown without a catalyst would find limited demand to slow it.