
$BNB price is trading close to $600, a major psychological support level for the token. Can bulls manage to defend it now that Binance has revealed a new prediction market feature within its self-custody wallet?
Binance, the leading crypto exchange in the world, revealed on Tuesday that it is rolling out a new prediction market feature directly in its crypto wallet through third-party providers such as Predict.fun.
The new prediction market feature allows traders to bet on real-world events, including politics, sports, crypto-related developments, and more, without the need to leave the wallet. The Binance team noted that such a feature would enable access to multiple prediction platforms while maintaining the security of decentralized self-custody.
The launch comes at a time when investors increasingly turn towards prediction markets, which have become a cornerstone of decentralized finance engagement. Notably, Coinbase recently expanded into the prediction market sector through a strategic partnership with Kalshi. Similarly, Crypto.com has integrated similar tools to capture growing retail interest.
As for the prediction market feature within Binance Wallet, it may integrate the yield-generating mechanisms often found in $BNB Chain-based platforms, where funds that have been staked by holders serve as collateral for their predictions.
Such utility could increase the organic demand for the $BNB token as more users start utilizing the prediction feature. This, in turn, could provide the necessary buying pressure to stabilize the price above current levels.
$BNB price analysis
On the daily chart, $BNB price is trading at $602.5 at press time, near the strong pivot reversal level of the Murrey Math lines at $625.
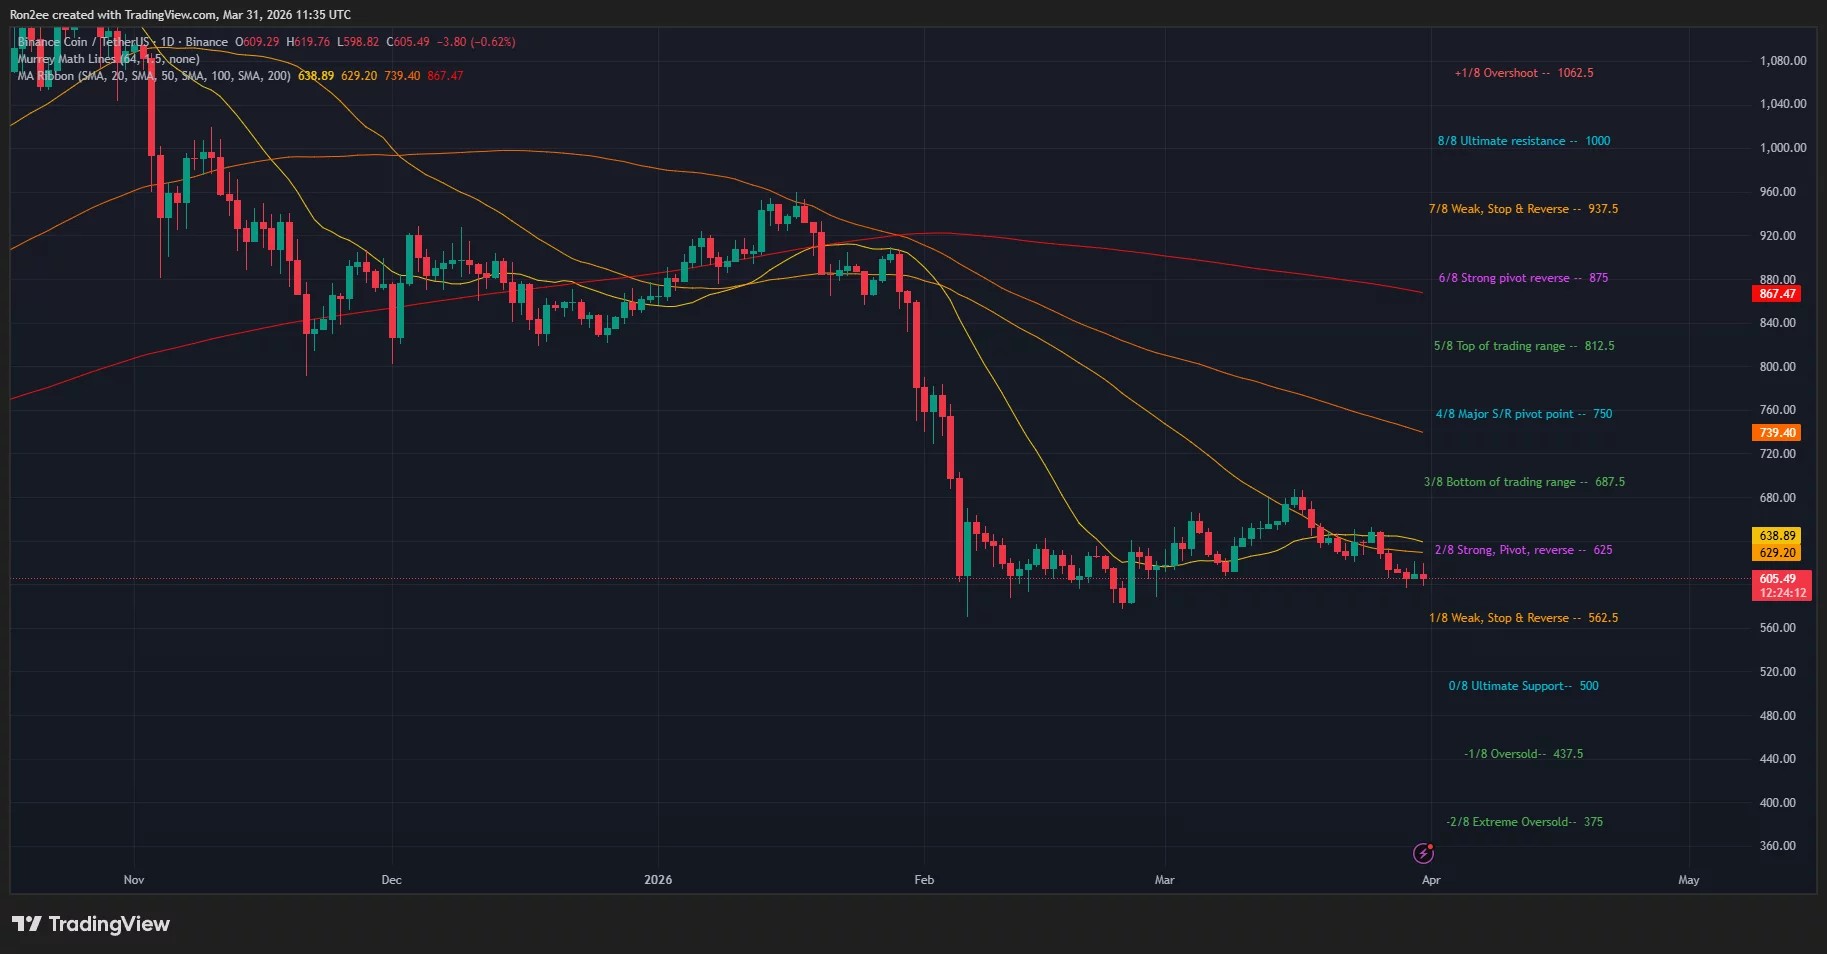
Technical indicators seem to portray a mixed outlook for $BNB price ahead. Notably, the 20-day SMA has formed a bullish crossover with the 50-day SMA, a sign that the token could see more price appreciation in the short-term.
However, the Aroon Down shows a reading of 85.71% while the Aroon Up sits at 0% while the MACD lines have pointed downwards, signs that short-term momentum is currently fading.
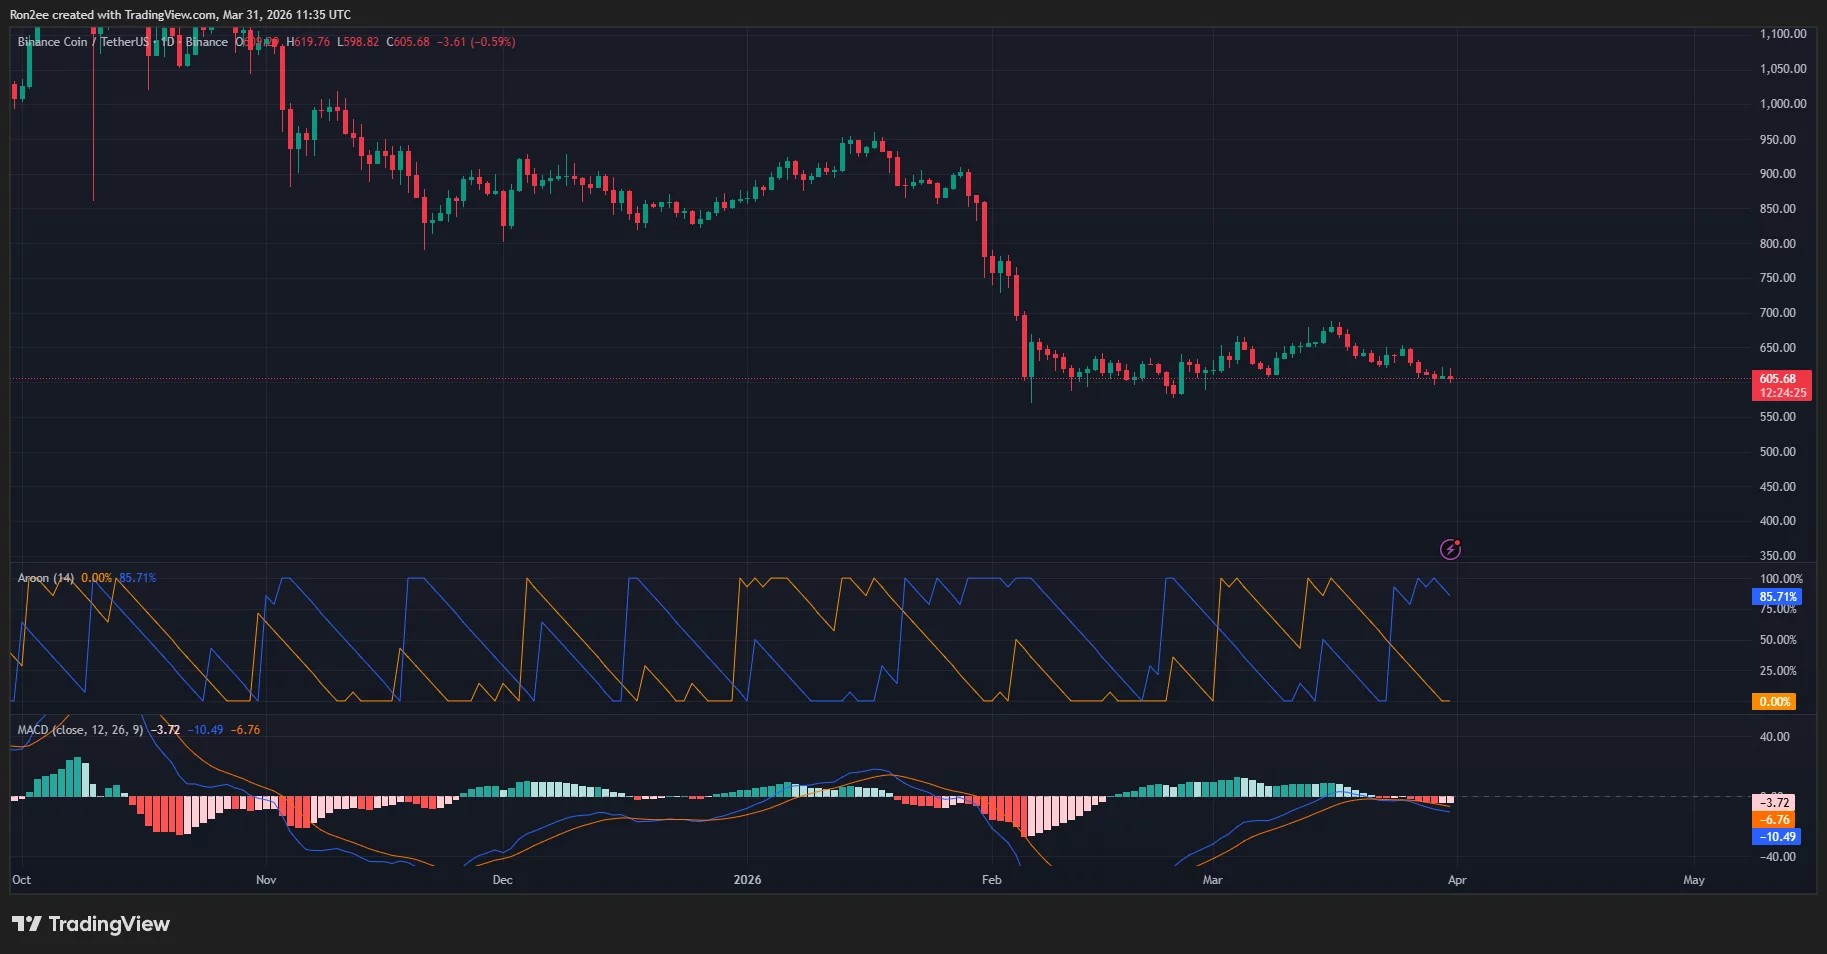
Such a mixed technical picture suggests that the market could be looking at a period of consolidation ahead.
For now, the most immediate resistance level that traders would be keeping an eye on is the $625 level. A decisive break above this point could trigger a move toward yearly highs.
On the contrary, $562.5, where the weak stop and reverse of the Murrey Math lines are located, remains the primary safety net for bulls.