Dogecoin Price Prediction: DOGE Bollinger Band Squeeze Tightens As X Money Launch Approaches
coinedition.com
30 March 2026 16:02, UTC
Dogecoin has been range-bound between $0.09 and $0.15 for roughly a year, according to Motley Fool, and the daily chart reflects exactly that. $DOGE sits at $0.0926 on March 30, near the lower Bollinger Band as the bands compress to their tightest range since January. X Money launches next month, and while the initial rollout is fiat-only, crypto speculation around Dogecoin is already building.
$DOGE Daily Chart: Bollinger Band Squeeze With SAR Overhead
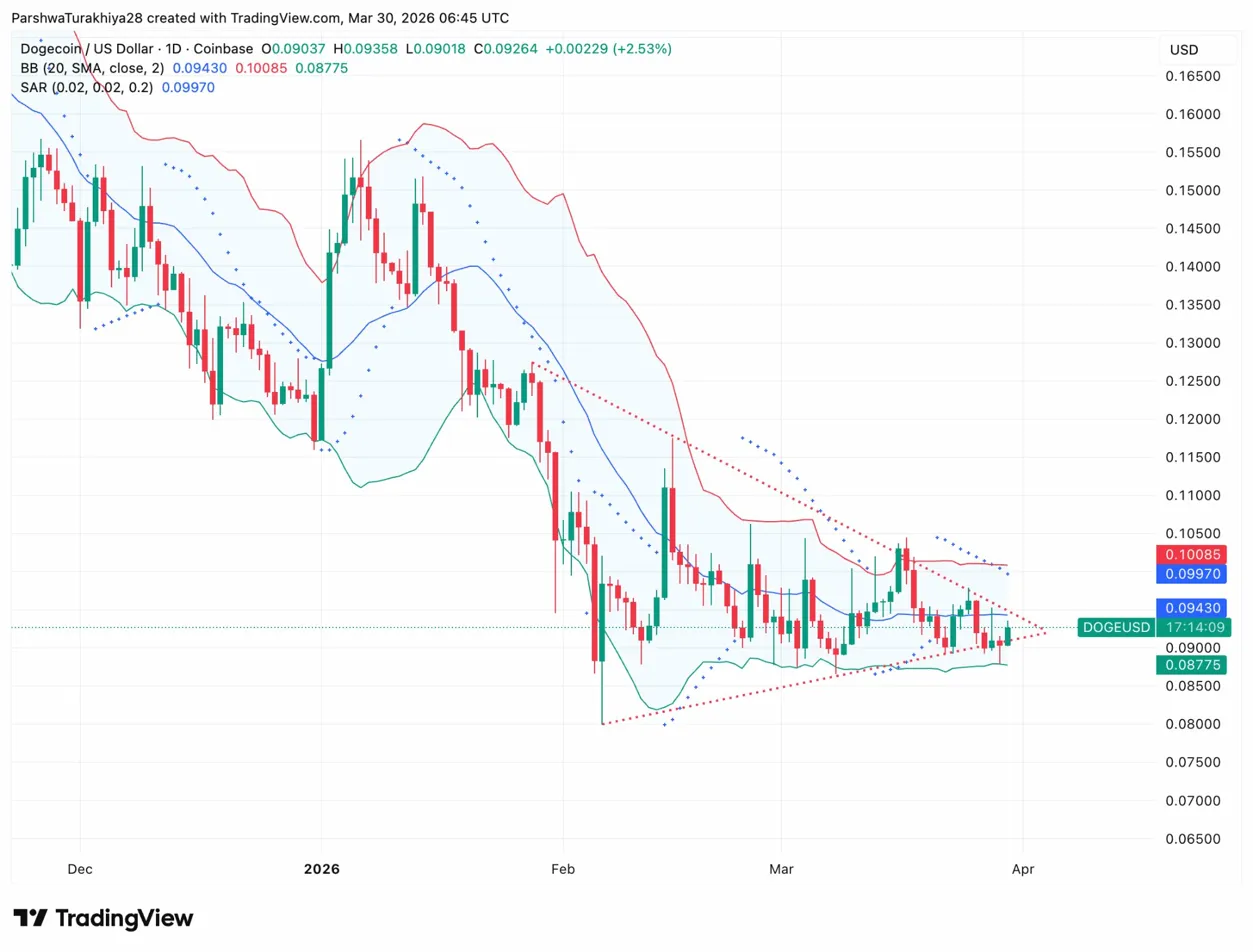
$DOGE Daily Price Action (Source: TradingView)
The daily chart shows Bollinger Bands compressing sharply after months of wide, expanding bands during the downtrend. The upper band sits at $0.1009, the middle band at $0.0943, and the lower band at $0.0878. Price is trading between the lower and middle bands, with the SAR at $0.0997 sitting just above the upper band and acting as a double layer of resistance.
Know when your coins move
Alerts, real-time prices, and market news — all in one app
4.8 based on 40K reviews in the App Store and Google Play
Band squeezes of this kind after a prolonged trend typically precede a sharp directional move, and the direction usually becomes clear within a few candles. The dotted ascending trendline from the February low is rising toward current price, adding support from below. A daily close above the middle band at $0.0943 would shift the immediate structure in favor of bulls, but the SAR at $0.0997 needs to flip for any sustained move to develop. Below, the lower band at $0.0878 has held every close since early March.
Key levels:
Lower Bollinger Band: $0.0878
Middle Bollinger Band: $0.0943
SAR resistance: $0.0997
Upper Bollinger Band: $0.1009
Breakout target: $0.1200 to $0.1300
Downside if lower band breaks: $0.0800
Will X Money Push $DOGE Above $0.10 In April?
X Money launches next month as a peer-to-peer fiat payment system built in partnership with Visa. Crypto is not part of the initial rollout, but Musk’s track record with Dogecoin makes the absence of a crypto feature more of a delay than a decision. He has previously called himself the Dogefather, accepted $DOGE as payment at Tesla and SpaceX online stores, and built much of the early Dogecoin retail base through social media.
Motley Fool noted that even without direct crypto integration, the idea of Dogecoin being used for payments on X is enough to reignite retail enthusiasm, which has historically been the primary driver of $DOGE price moves. The last meaningful catalyst was the $DOGE department announcement in late 2024. X Money represents a more tangible use case, with a real launch date and a payment infrastructure already in place. Whether crypto joins the platform in month one or month six, the narrative is already running ahead of the product.
$DOGE Derivatives: Longs Taking On Risk Near The Squeeze
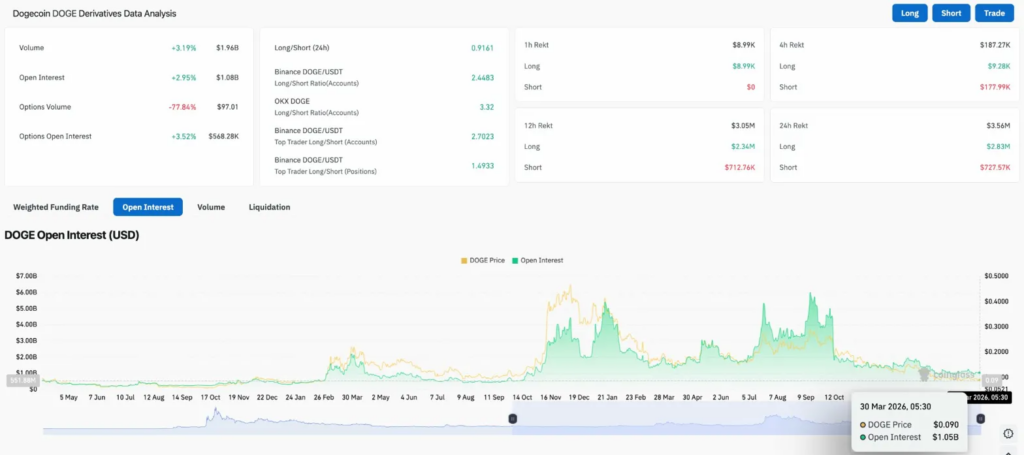
$DOGE Derivatives Data (Source: Coinglass)
Futures volume rose 3.19% to $1.96B with OI up 2.95% to $1.08B, both moving in the same direction, pointing to fresh money entering rather than old positions rolling over. Binance accounts are sitting at a 2.45 long/short ratio, OKX even more bullish at 3.32.
Despite that lean, longs absorbed $2.83M in liquidations over 24 hours against $727.57K for shorts. Bulls are positioned aggressively but keep getting shaken out near $0.0950. OI at $1.05B is a fraction of the $5B to $6B seen at the late 2025 peak, meaning there is significant room for leverage to stack up quickly if the band squeeze resolves to the upside.
$DOGE Price Prediction: Breakout Or Breakdown This Week
Upside: Close above the middle Bollinger Band at $0.0943 and the SAR at $0.0997 becomes the next test. Flipping the SAR on the daily puts $0.1009 in range, and a sustained close above the upper band opens $0.1200. X Money headlines sustaining through April give retail a reason to stay engaged and add the kind of momentum that has driven every major $DOGE rally historically.
Downside: Lose the lower Bollinger Band at $0.0878 and the ascending trendline from February breaks simultaneously. With options volume near zero and no institutional floor visible in the ETF data, a break below $0.0878 has little to absorb it before $0.0800. The band squeeze resolves within days in one direction or the other, and the derivatives data shows longs are already positioned for the upside scenario.

 coinedition.com