
The Litecoin ecosystem is officially moving beyond its traditional role as a pure payment network by embracing Ethereum Virtual Machine (EVM) compatibility through the highly anticipated LitecoinVM. This strategic upgrade is designed to unlock an entirely new frontier of smart contract capabilities, decentralized applications, and an untapped market of millions of Web3 users.
Despite a massive leap toward decentralized infrastructure, the Litecoin Price has seen a dip, currently trading at the $53.88 level. The Litecoin token ($LTC) is currently down 1.7% on the 24-hour timeframe, compounding a 4.5% weekly and 3.8% monthly drawdown, and shows a market cap of $4.14B and a 24-hour trading volume of $272M, showing some promise for an uptick.
Litecoin EVM Announced
The introduction of LitecoinVM arrives at a time when the network is operating at a high pace. According to recent data shared by the core development team, the blockchain has already processed over 15 million transactions exactly twelve weeks into 2026, averaging over a million transactions every single week. The aggressive on-chain growth shows the network is rapidly expanding its utility footprint. Furthermore, this technological pivot is built upon a foundation of absolute regulatory clarity.
For over a decade, Litecoin has stood as one of the most resilient networks in the world. Now with @LitecoinVM a new chapter begins.. build the future on Litecoin. https://t.co/eZLpJMjcar
— Litecoin Foundation ⚡️ (@LTCFoundation) March 27, 2026
Celebrating the anniversary of its official classification as a commodity by the Commodity Futures Trading Commission (CFTC), the asset offers developers a legally transparent framework. Being a fairly launched asset, this pristine commodity status shields the network from the regulatory headwinds currently plaguing many contemporary altcoins, making it a highly attractive, hard-money foundation for future EVM development.
Analyzing Litecoin Price Chart
The 15-minute Litecoin price chart reveals a descending parallel channel that has guided the price action over the past trading sessions. Following a rejection near the upper resistance zone of $56.50 earlier in the week, $LTC endured a sequence of lower highs and lower lows, eventually finding crucial localized support at the $53.26 level.
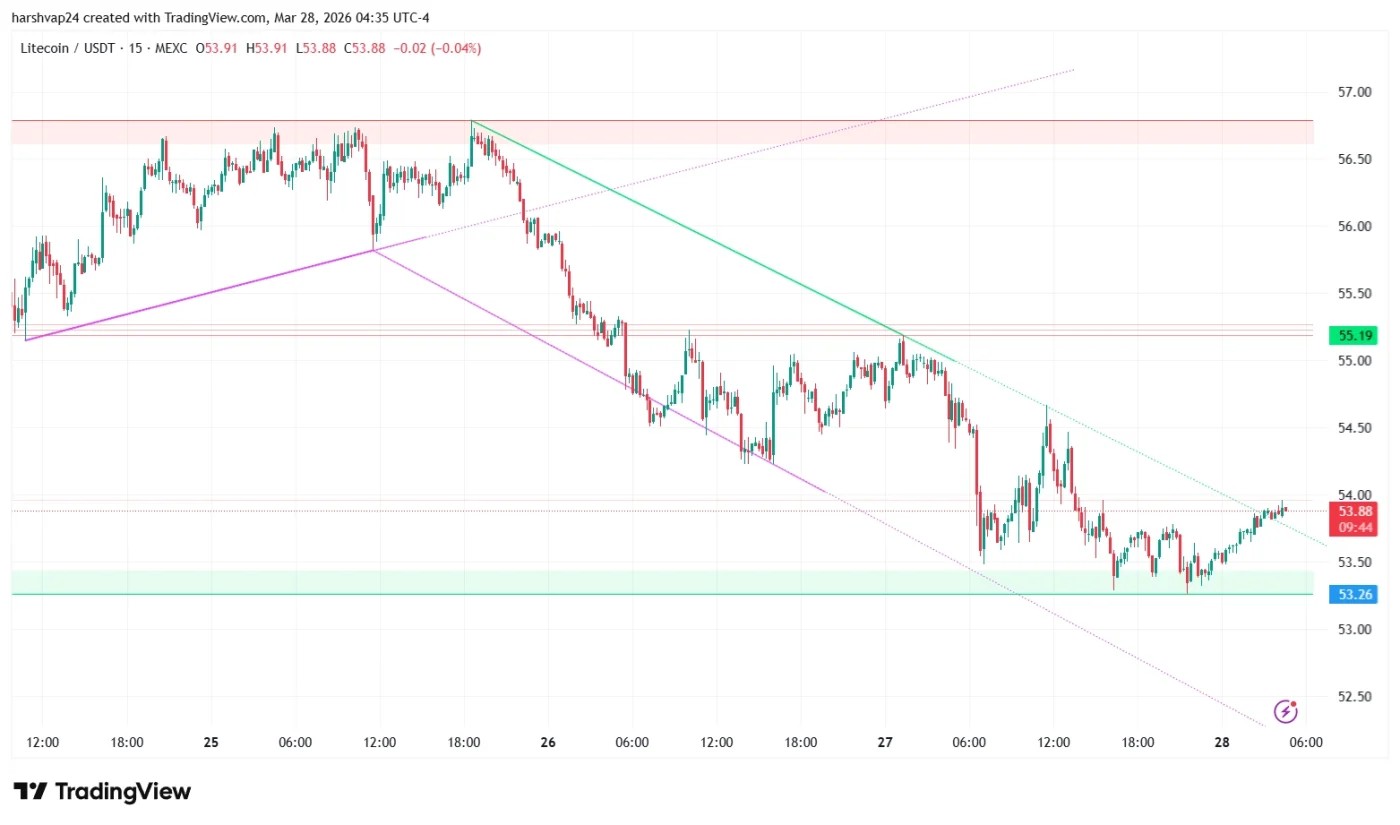
The recent price action shows an effort by the bulls to execute a relief bounce from this lower boundary, as the token attempts to claw its way back toward the channel’s midline. However, the relief recovery faces immediate overhead friction, requiring a sustained buying volume to overcome the strong descending resistance in the current price trend.
Putting technical momentum indicators into the analysis provides a deeper understanding of the current movement at the $53.88 mark. The shorter-term Exponential Moving Averages (EMAs) continue to slope downward, acting as a dynamic ceiling that suppresses immediate upward volatility. For a true structural reversal to materialize, the price must decisively reclaim the 50-period EMA on this lower timeframe.
Meanwhile, the Relative Strength Index (RSI) is currently attempting to recover from the lower bounds of the chart. Having recently dipped near oversold territory, the RSI is curving upward, suggesting that the immediate selling pressure may be exhausting itself and allowing for a potential continuation of this relief bounce.
Corroborating this slight shift in momentum, the Moving Average Convergence Divergence (MACD) indicator is showing early signs of a bullish crossover. The histogram is printing fading red bars, and the MACD line is curling toward the signal line, hinting that buyers are beginning to actively accumulate positions at the $53.26 support floor.
Editor’s Note
If Litecoin’s price continues in a bullish range as the market begins to heavily price in the LitecoinVM narrative, the first major technical hurdle is breaking the structural resistance near the $56 level. A decisive, volume-backed close above this zone would invalidate the short-term bearish structure and likely trigger a rally toward the $60 supply zone.
But, the indicators do show a bearish scenario with the risk that macro market forces outweigh the positive fundamental news. If the current relief bounce stalls and the asset drops below the $53.26 support floor, it could begin a deeper corrective phase, and put the token in lower liquidity pools as traders prioritize short-term capital preservation.