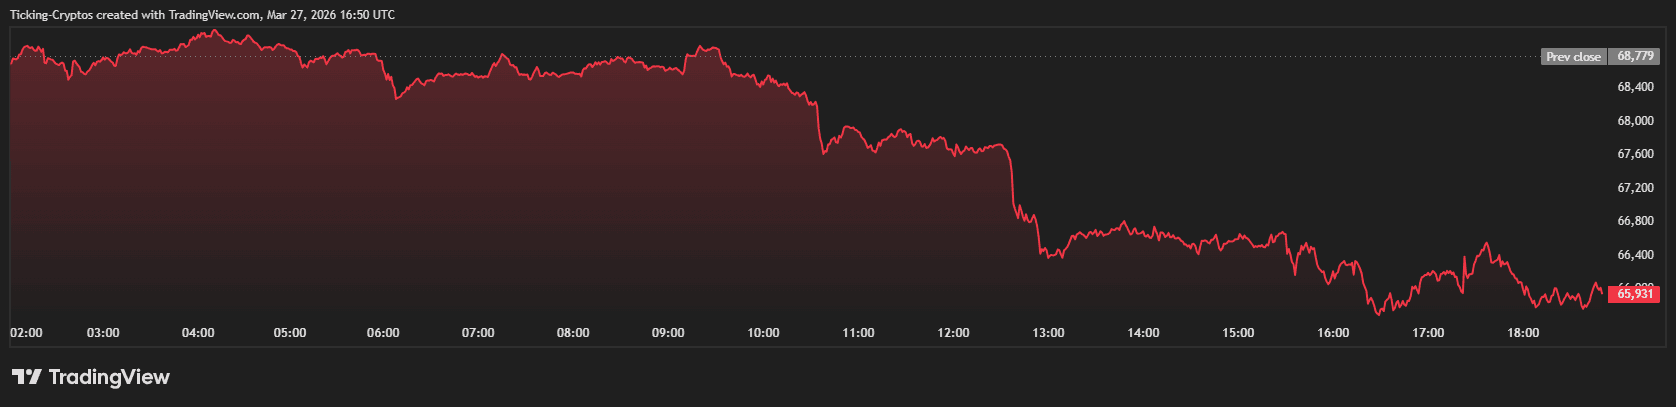
Simultaneously, as reported by Reuters, the threat of a full-scale regional war has spiked oil prices, leading investors to dump "risk-on" assets like $XRP in favor of cash and gold. Because $XRP maintains a high positive correlation with $BTC, the 4% drop in Bitcoin has translated into an even steeper decline for Ripple's native token.
$XRP Price Analysis: is $XRP REALLY Crashing?
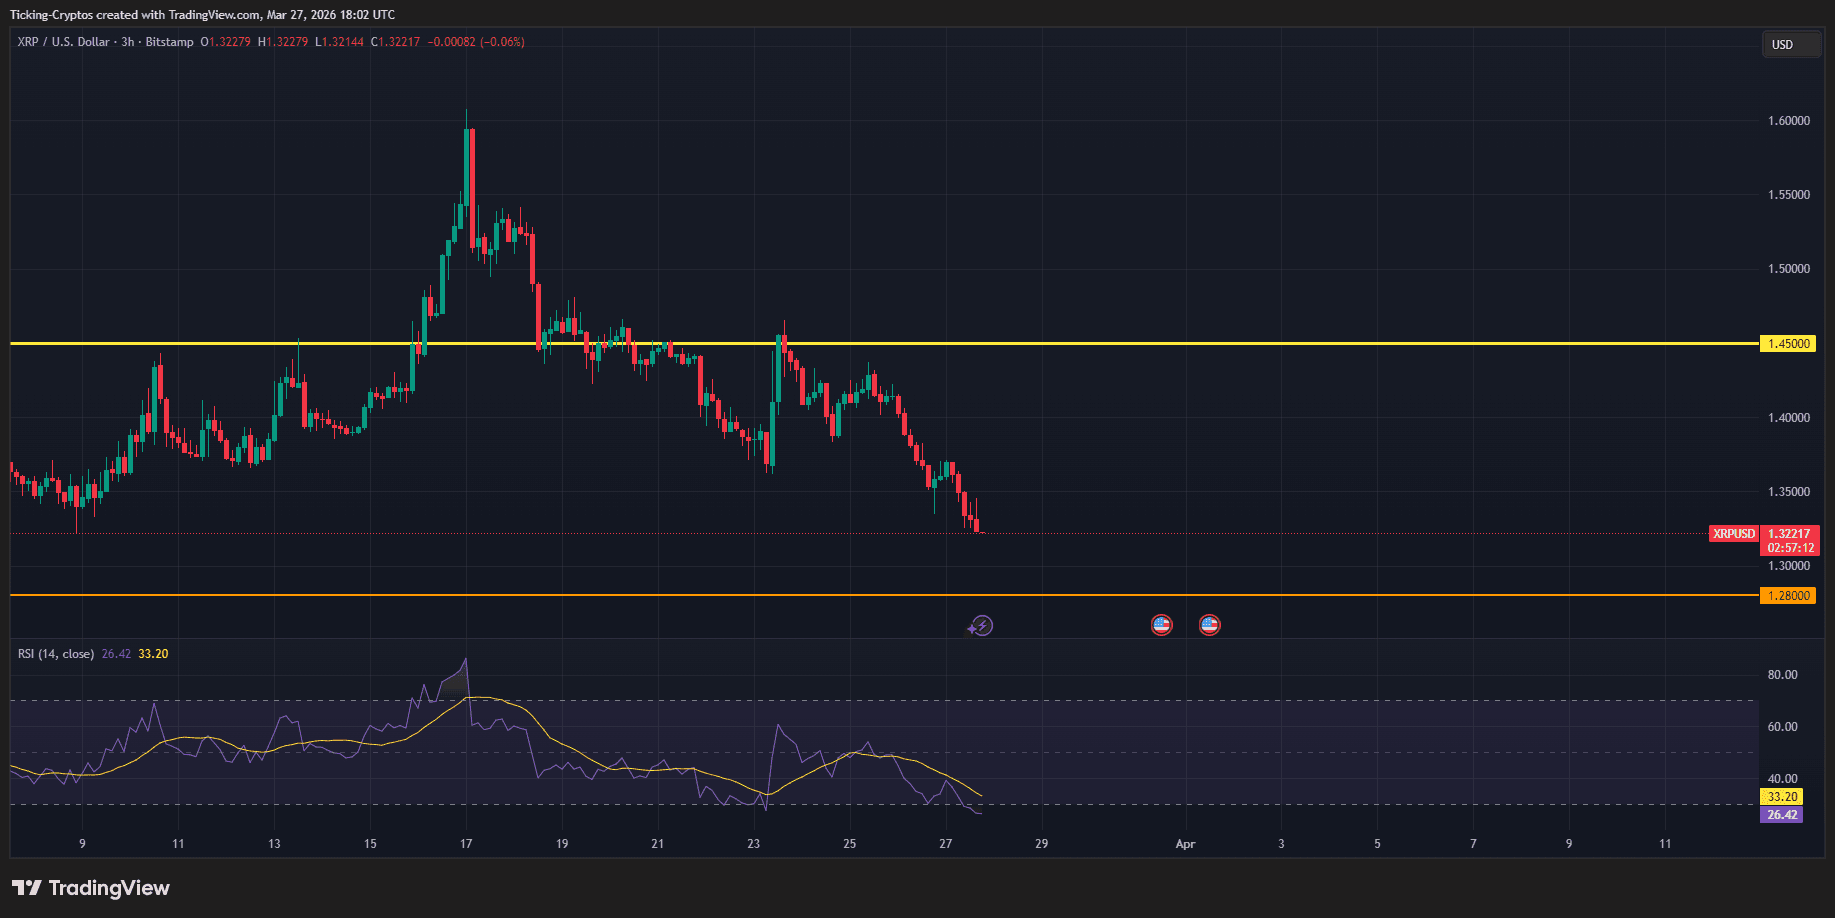
If we look at the 3-hour $XRP/USD chart below, we see a typical "break and retest" of bearish momentum. The technicals are currently screaming caution.
-
Support & Resistance Flip: $XRP has decisively broken below the critical psychological and structural support at $1.45. This level, which acted as a floor throughout mid-March, has now transitioned into a formidable resistance zone.
-
The Descent to $1.28: The price is currently in a "free-fall" zone with no significant historical volume profile support until the $1.28 mark. This yellow horizontal line represents the "Value Area Low" where buyers have historically stepped in.
-
RSI Oversold Signal: The Relative Strength Index (RSI) is currently printing at 26.42. In professional trading, any reading below 30 is considered "oversold." While this suggests a "dead cat bounce" or a relief rally could occur soon, in a high-volatility war environment, RSI can remain "embedded" in oversold territory for extended periods.
Correlation and Systematic Risk
The chart shows a series of lower highs and lower lows starting from the March 17 peak of nearly $1.60. This downward channel is a direct reflection of systematic risk entering the market. Institutional desks are likely reducing their exposure to $XRP not because of Ripple-specific news, but as part of a broader "de-risking" strategy.
Strategic Outlook
If the $1.28 support holds, we could see a period of consolidation. However, a break below this level could open the trapdoor toward $1.10.

 cryptoticker.io