
$SIREN is trading at $1.04, down 36.93% on the day after closing March 26 near $1.67. The token has lost approximately 50% of its value in under 24 hours.
The source of the volatility is not a single catalyst but a compounding loop of leveraged positioning, forced liquidations, and investor uncertainty that has turned $SIREN into a pure speculation vehicle this week.
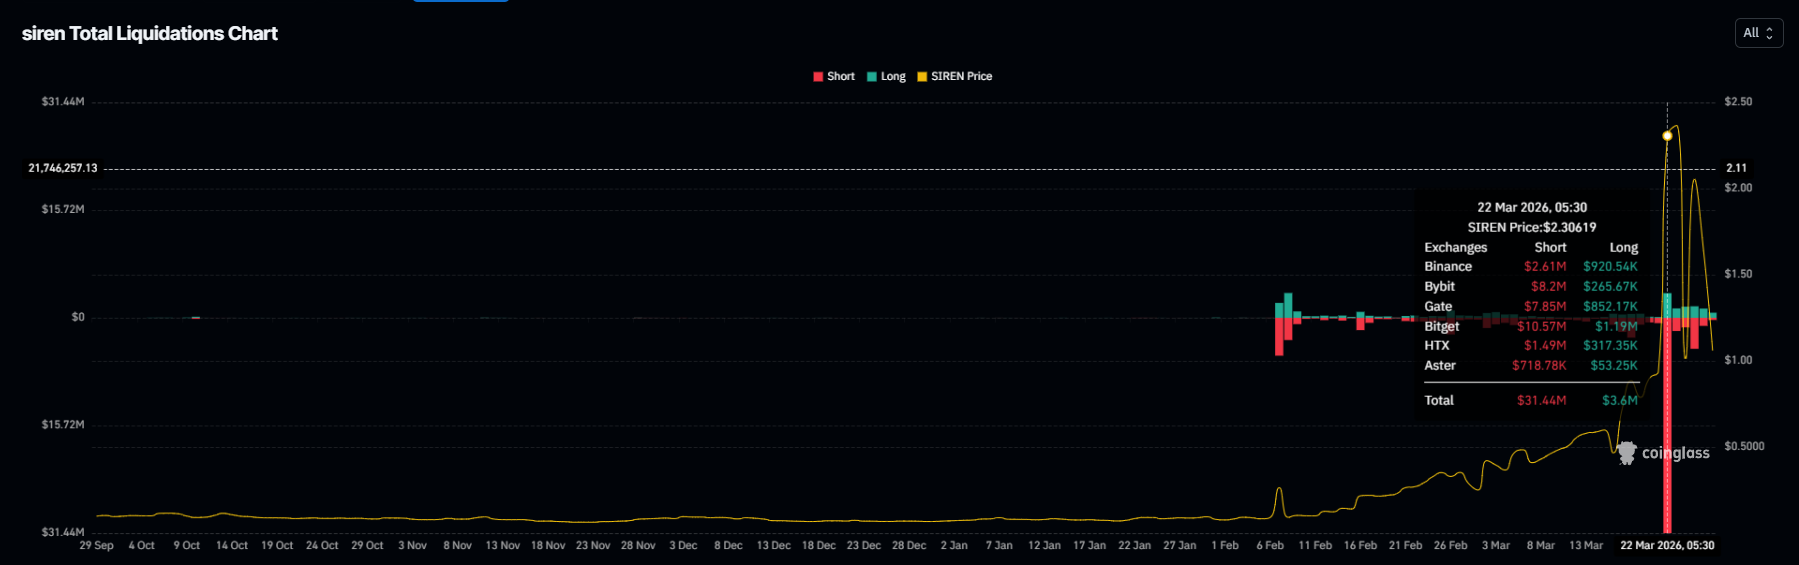
Shorts Liquidation Set Off the $SIREN Frenzy
The Coinglass total liquidations chart for $SIREN covers the entire period from late September 2025 through March 27, 2026. The chart is essentially flat until March 22, when a single bar extended to $31.44 million in short liquidations.
This event has dwarfed every prior liquidation event in the token’s history by a factor of several times, with the previous highest sitting at $5.5 million.
Want more token insights like this? Sign up for Editor Harsh Notariya’s Daily Crypto Newsletter here.
 $SIREN Liquidation Chart">
That imbalance produced the violent spike from $1.00 to above $2.50 in a matter of hours. What followed was equally sharp in the other direction. Traders who had been burned on their shorts then tried to capitalize on the long side, only to face the same fate as the price reversed.
Each directional move is now being driven by forced closures rather than organic buying or selling conviction. This creates a feedback loop that explains the extreme intraday swings visible on the daily chart from March 22 through March 27.
$SIREN Exposed To Shorts
The liquidation map shows that for the next directional move, cumulative short liquidation leverage builds sharply above the current price. At $2.11, cumulative short liquidation leverage reaches $5.23 million.
The total short liquidation exposure between $SIREN’s current price and $2.73 amounts to approximately $9 million across all leverage tiers.
This creates a mechanical setup that mirrors what happened on March 22. If the price reaches $2.11, $5.23 million in shorts get forced out, which would drive the price higher.
That move would then trigger the remaining $3.77 million in short leverage stacked above $2.11 toward $2.50. However, with the broader investor base having already experienced this cycle once this week, the question is whether sufficient buying pressure exists to push the price to $2.11 in the first place.
$SIREN Investors Are Buying the Dip to Sell Into the Next Spike
$SIREN’s holder base is dominated by short-term participants rather than committed long-term investors. Exchanges witnessed a balance drop to 69 million $SIREN as outflows dominated in the past 24 hours.
At 5:00 AM on March 27, the token price was $1.67, and the exchange balance sat at 71.26 million $SIREN, representing 9.79% of supply. By 9:00 AM, the price had dropped to $1.10, and the exchange balance had fallen to 69 million.
This means that approximately 2 million $SIREN were purchased off exchanges as the price fell. Those buyers are not accumulating for the long term. They are positioning to sell into the next spike.
The price chart confirms that $1.00 and $2.00 are the two psychological levels governing the current range. Below $1.00, the chart shows $0.46 as the next visible support.
Above $2.00, the $2.11 short liquidation cluster is the immediate trigger. Until the broader market provides a directional catalyst to resolve this compression, $SIREN will continue to oscillate between these two levels. This is because traders on both sides capitalize on forced liquidation events.
The post $SIREN Price Crashes 50% In 24 Hours: What’s Causing The Pump and Dump? appeared first on BeInCrypto.