However, sustained selling pressure could weaken buyer confidence. Consequently, the market may shift toward testing deeper liquidity pockets if this support fails.
Bearish Structure Signals Continuation
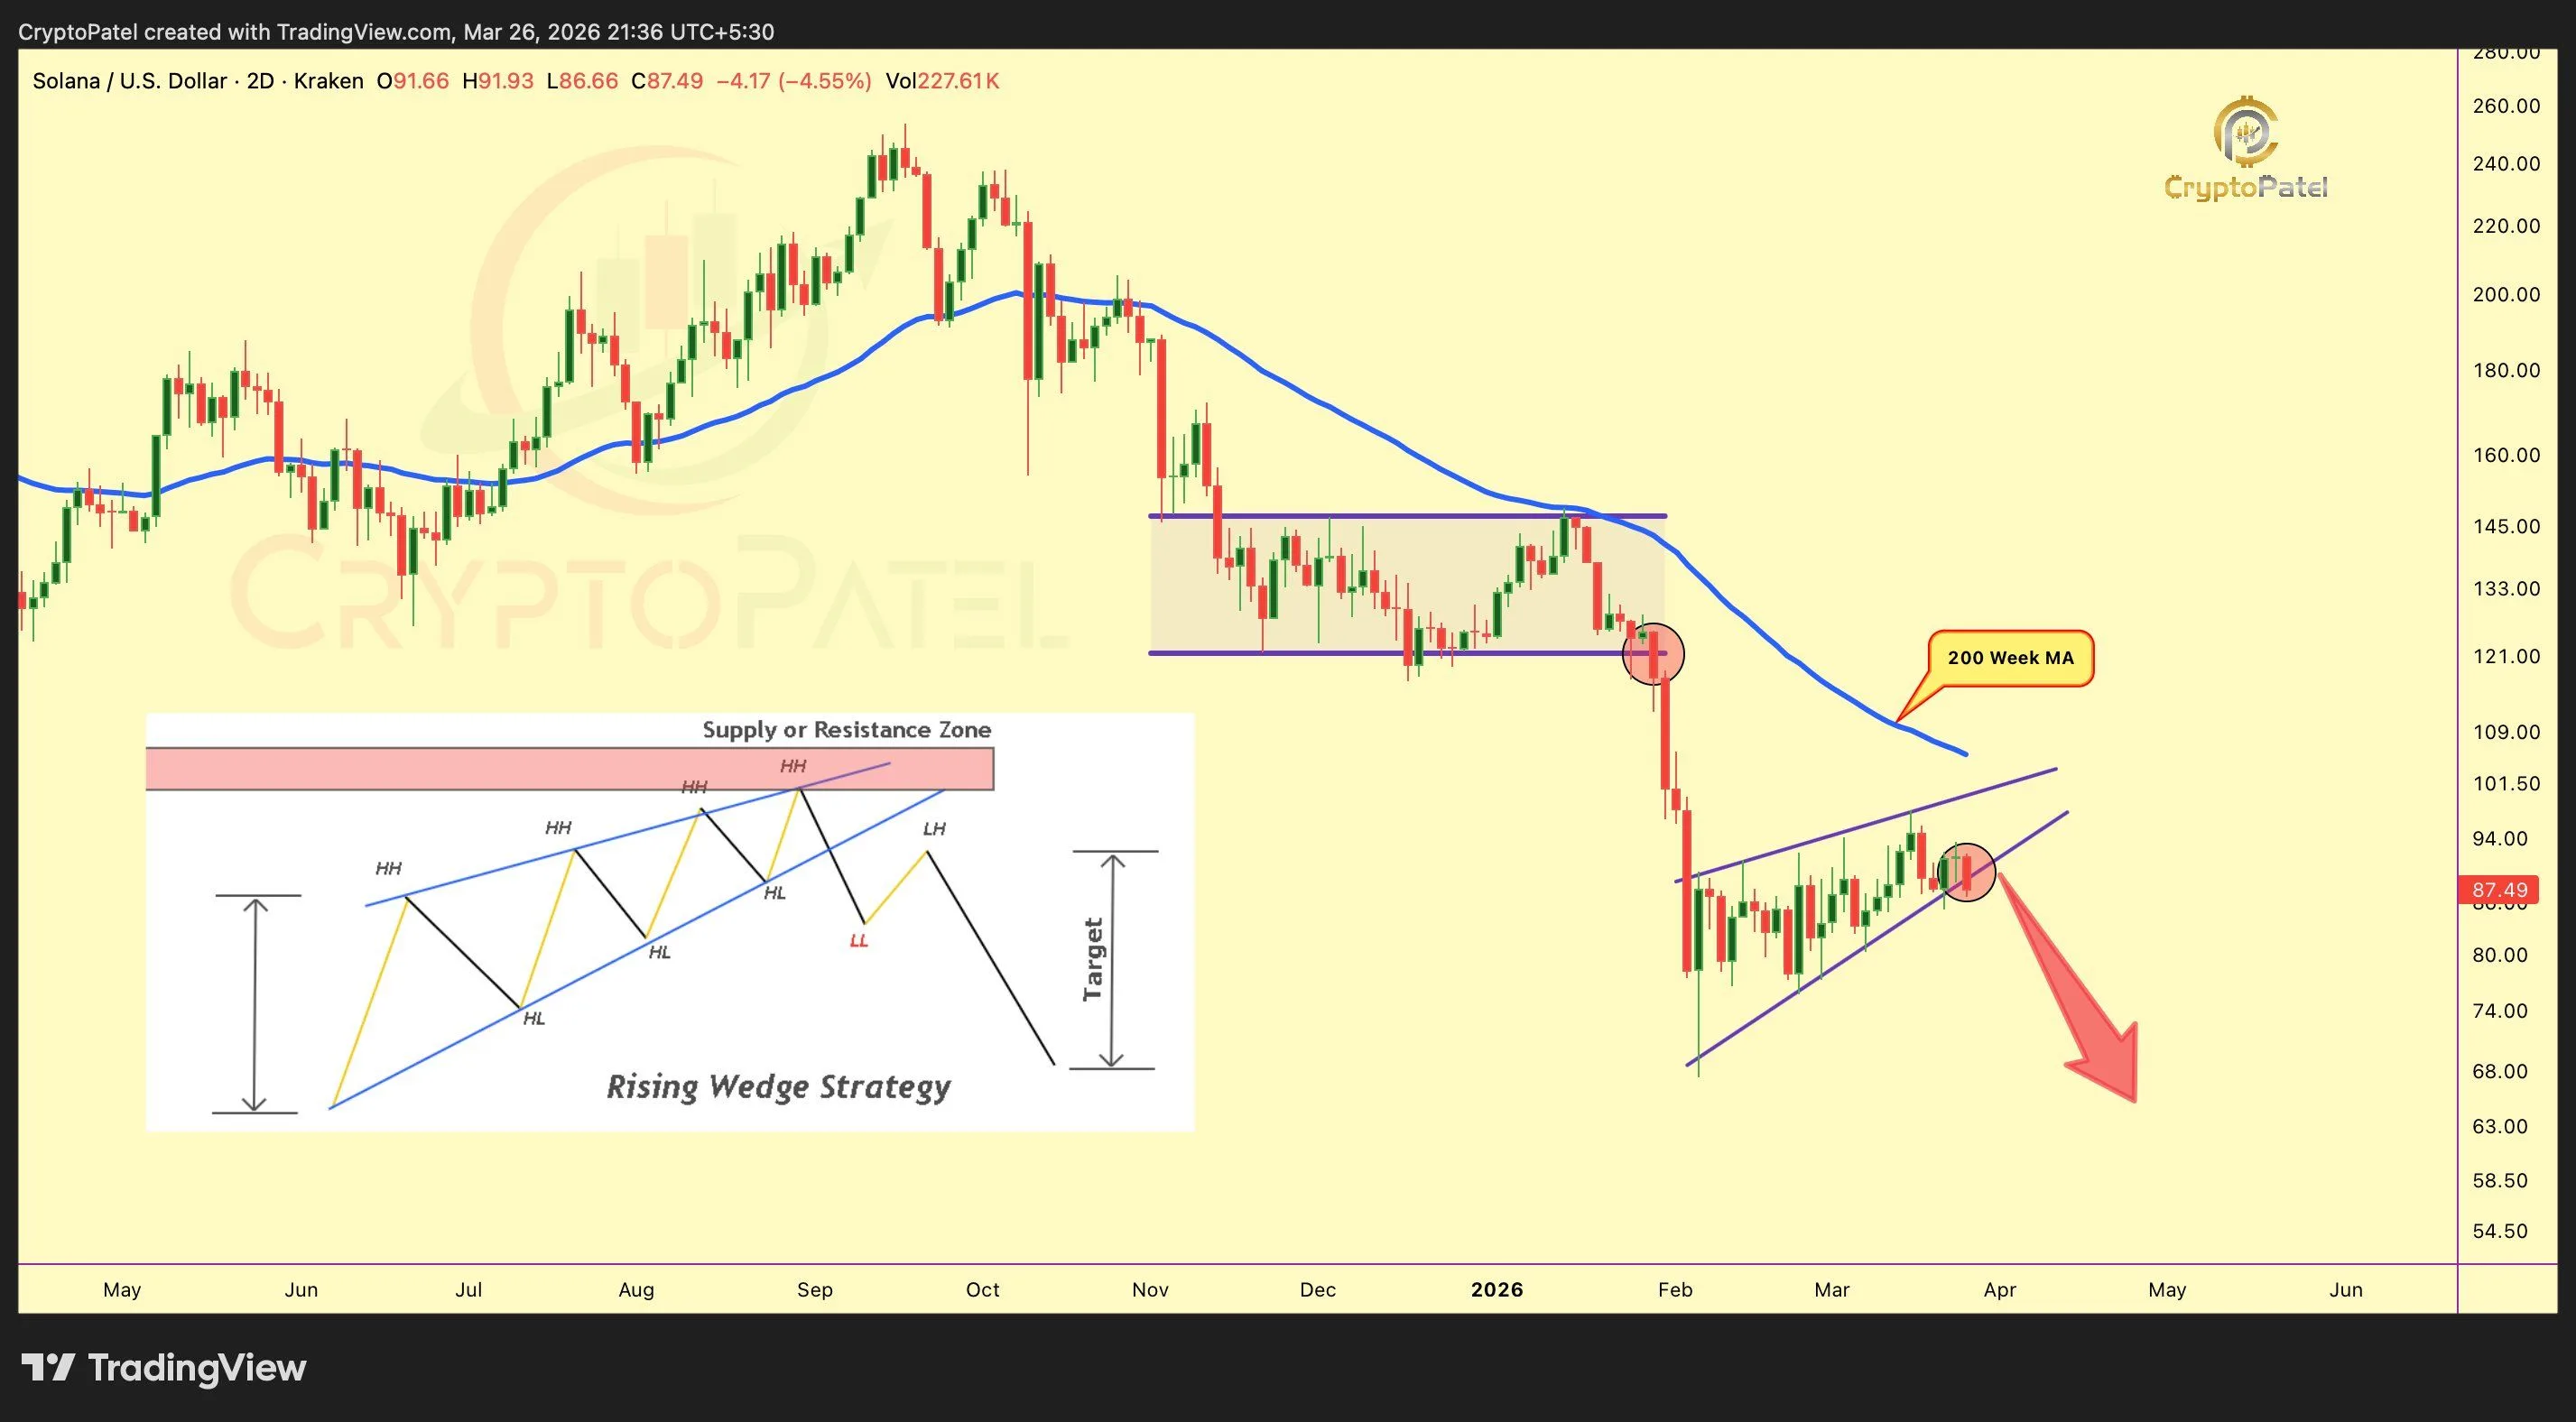
Meanwhile, Crypto Patel outlines a bearish continuation pattern on the two-day chart. Price recently rejected the $140–145 resistance zone and broke below $120 support. This move confirmed a broader weakening trend.
Moreover, the formation of a rising wedge suggests fading bullish strength. Although price formed higher lows, upward momentum continues to decline. Current levels near $87 sit at the wedge’s lower boundary.
Source: X
If breakdown occurs, Patel expects downside expansion toward $80 and $70–$65. Additionally, resistance remains firm between $95–$100 and $120. Hence, the broader structure still favors bearish continuation unless momentum shifts.
Trendline Support Offers Recovery Chance
On the other hand, CryptoCurb highlights a potential recovery scenario. Solana currently trades along a rising trendline support formed during recent accumulation. Multiple touches confirm strong buyer interest at this level.
Significantly, price compression below the $90–95 resistance suggests a breakout setup. If buyers defend the trendline, momentum could push $SOL above $100 quickly. Above this level, further upside toward $120–150 becomes possible.
However, losing this support would invalidate the bullish setup. Consequently, price could revisit $80 or lower zones before stabilizing.
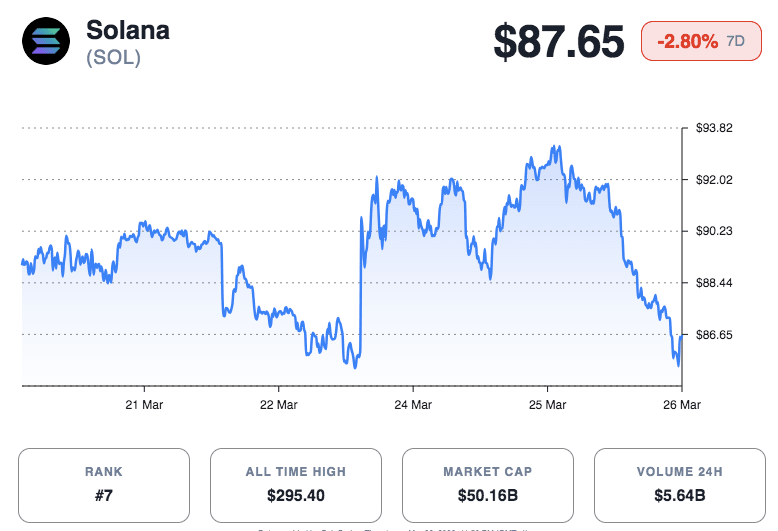
Solana as of press time trades at $87.65, with daily volume exceeding $3.7 billion. The asset declined 6.62% in 24 hours and 2.80% over the week. With a market cap near $48.9 billion, $SOL remains at a decisive technical crossroads.

 coinpaper.com