
OFFICIAL $TRUMP ($TRUMP) is trading at $3.115, down 5.15% on the day and pressing toward its all-time low of $2.705. The Fibonacci structure shows the price has already broken below the 0.236 level at $3.128, with no meaningful support between the current price and the all-time low floor.
Two on-chain signals confirm that holders are not buying the dip. They are exiting. A rising impeachment probability on prediction markets has added a direct political catalyst to the technical breakdown.
Trump’s Impeachment Odds at 69% Before 2028
Kalshi, the regulated prediction market platform, currently prices the probability of Trump being impeached before January 1, 2028, at 69%. That reading has been climbing steadily since November 2025, rising from the low 40s to its current level with no meaningful reversal.
The nearer-term contract — impeachment before January 1, 2027 — sits at 14%, while the contract for impeachment before June 1, 2026, is priced at just 2%.
Want more token insights like this? Sign up for Editor Harsh Notariya’s Daily Crypto Newsletter here.
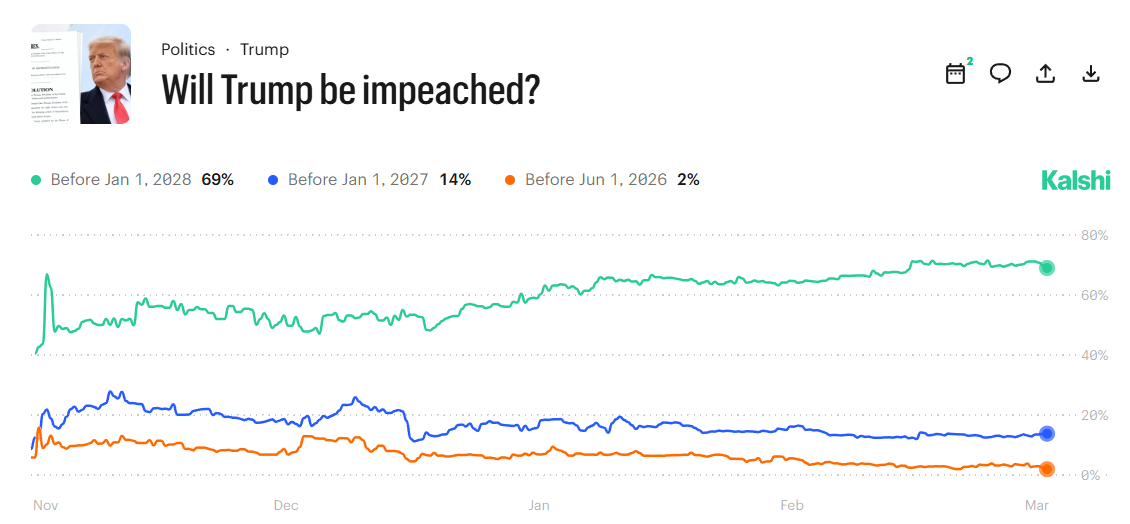
The market is not pricing an imminent event, but the long-run probability rising to 69% introduces sustained political uncertainty that removes a central value proposition from the $TRUMP token, which is directly tied to the president’s public persona and political brand.
$TRUMP Sellers Have Returned
The $TRUMP exchange net position change chart covers March 3 through March 25, 2026. The first ten days of March were dominated entirely by red bars — consistent net outflows of between 5 million and 10 million tokens per day, with March 7 registering the largest outflow, nearly 10 million tokens.
A sharp reversal arrived on March 13 and 14, with a single green bar reaching approximately 22 million tokens — the largest inflow event on the chart. That spike coincided with $TRUMP’s brief price recovery to the 0.786 Fibonacci level at $4.114. However, exchange flows normalized almost immediately after, returning to near-zero by March 17 and oscillating in a very tight range through March 25.
The lack of follow-through buying after the March 14 inflow spike is telling. Tokens moved onto exchanges in large volume, price briefly recovered. As a result, the situation stabilized at lower levels rather than continuing higher. That pattern is consistent with short-term traders selling into the brief rally rather than fresh buyers accumulating.
$TRUMP Holders Are Selling At a Loss
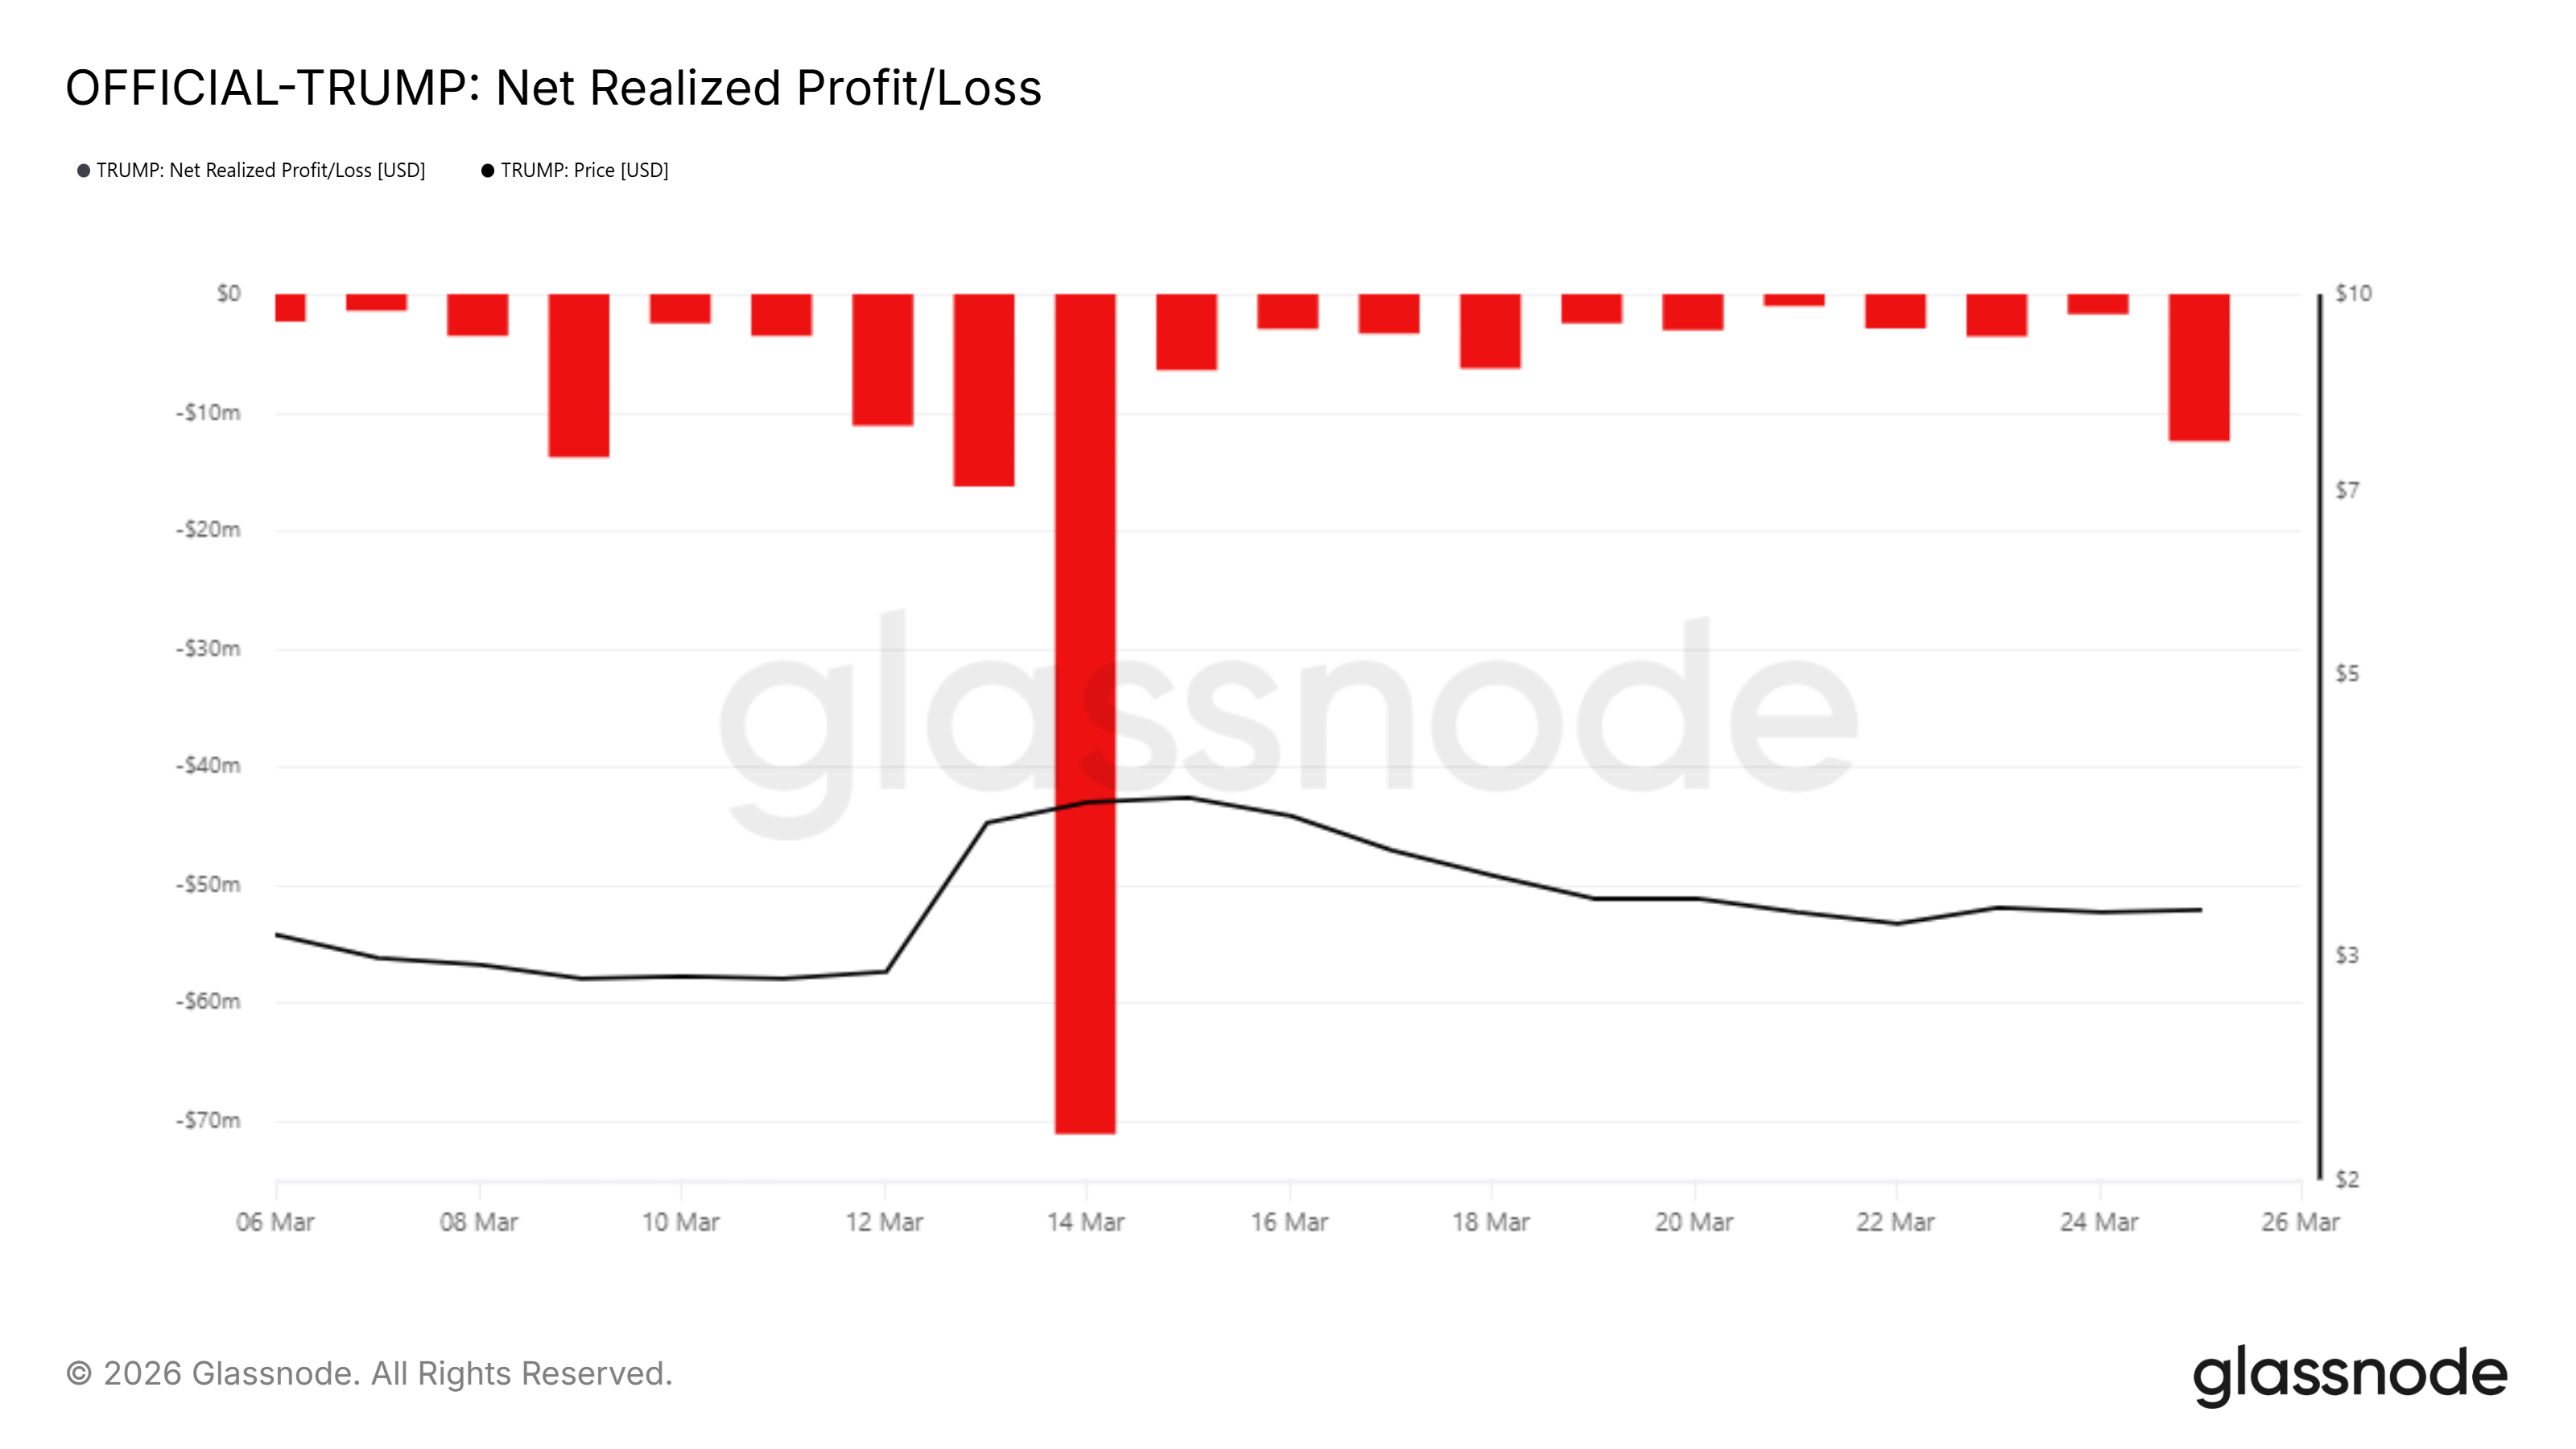
The net realized profit/loss chart for $TRUMP from March 6 through March 25 shows an uninterrupted sequence of red bars below the zero line. Not a single day in that span recorded a net realized gain for holders.
The largest single-day realized loss occurred on March 14, reaching approximately -$70 million — the worst reading on the chart. That day aligns directly with the large exchange inflow spike. This confirms that the tokens sent to exchanges were sold at a loss rather than accumulated.
The realized loss metric has moderated since then, hovering between -$5 million and -$15 million per day through late March. However, it has not moved above zero once.
 $TRUMP Realized Losses">
Sustained negative realized profit/loss with no green bars indicates that the seller base is not composed of profit-takers. It is composed of holders exiting positions at whatever price the market offers. This is the behavioral signature of capitulation rather than healthy rotation.
$TRUMP Price Could Land Towards ATL
$TRUMP has broken below the 0.236 Fibonacci level at $3.128, the last horizontal support above the all-time low. The Fibonacci grid runs from the zero level at $2.705 to the 1.0 level at $4.497.
The annotated measured move on the chart shows a prior 22.98% decline from $4.045 to $3.115. A 13% decline from current levels would bring the price below $2.705 and set a new all-time low below it. The above-mentioned factors make it very likely for the same to happen.
A daily close above the 0.382 Fibonacci level at $3.390 would be the first sign of stabilization. A sustained close above $3.812 would shift the $TRUMP price structure from bearish to neutral and invalidate the new all-time low thesis. Until either of those levels reclaim on a daily close, on-chain data points toward $2.705 as the next target.
The post Donald Trump’s Impeachment Odds Rise To 70%, $TRUMP Price May Form New Low appeared first on BeInCrypto.