Hedera ($HBAR) is trading at $0.0951, struggling to hold above the $0.0930 support level. A descending trendline on the daily chart and persistent capital outflows have kept any recovery attempt shallow and short-lived.
Six months of futures data and two converging bearish signals now point toward the same outcome. Unless buyers push $HBAR above $0.1031, the path of least resistance remains downward.
Bearish Control Persists Over $HBAR
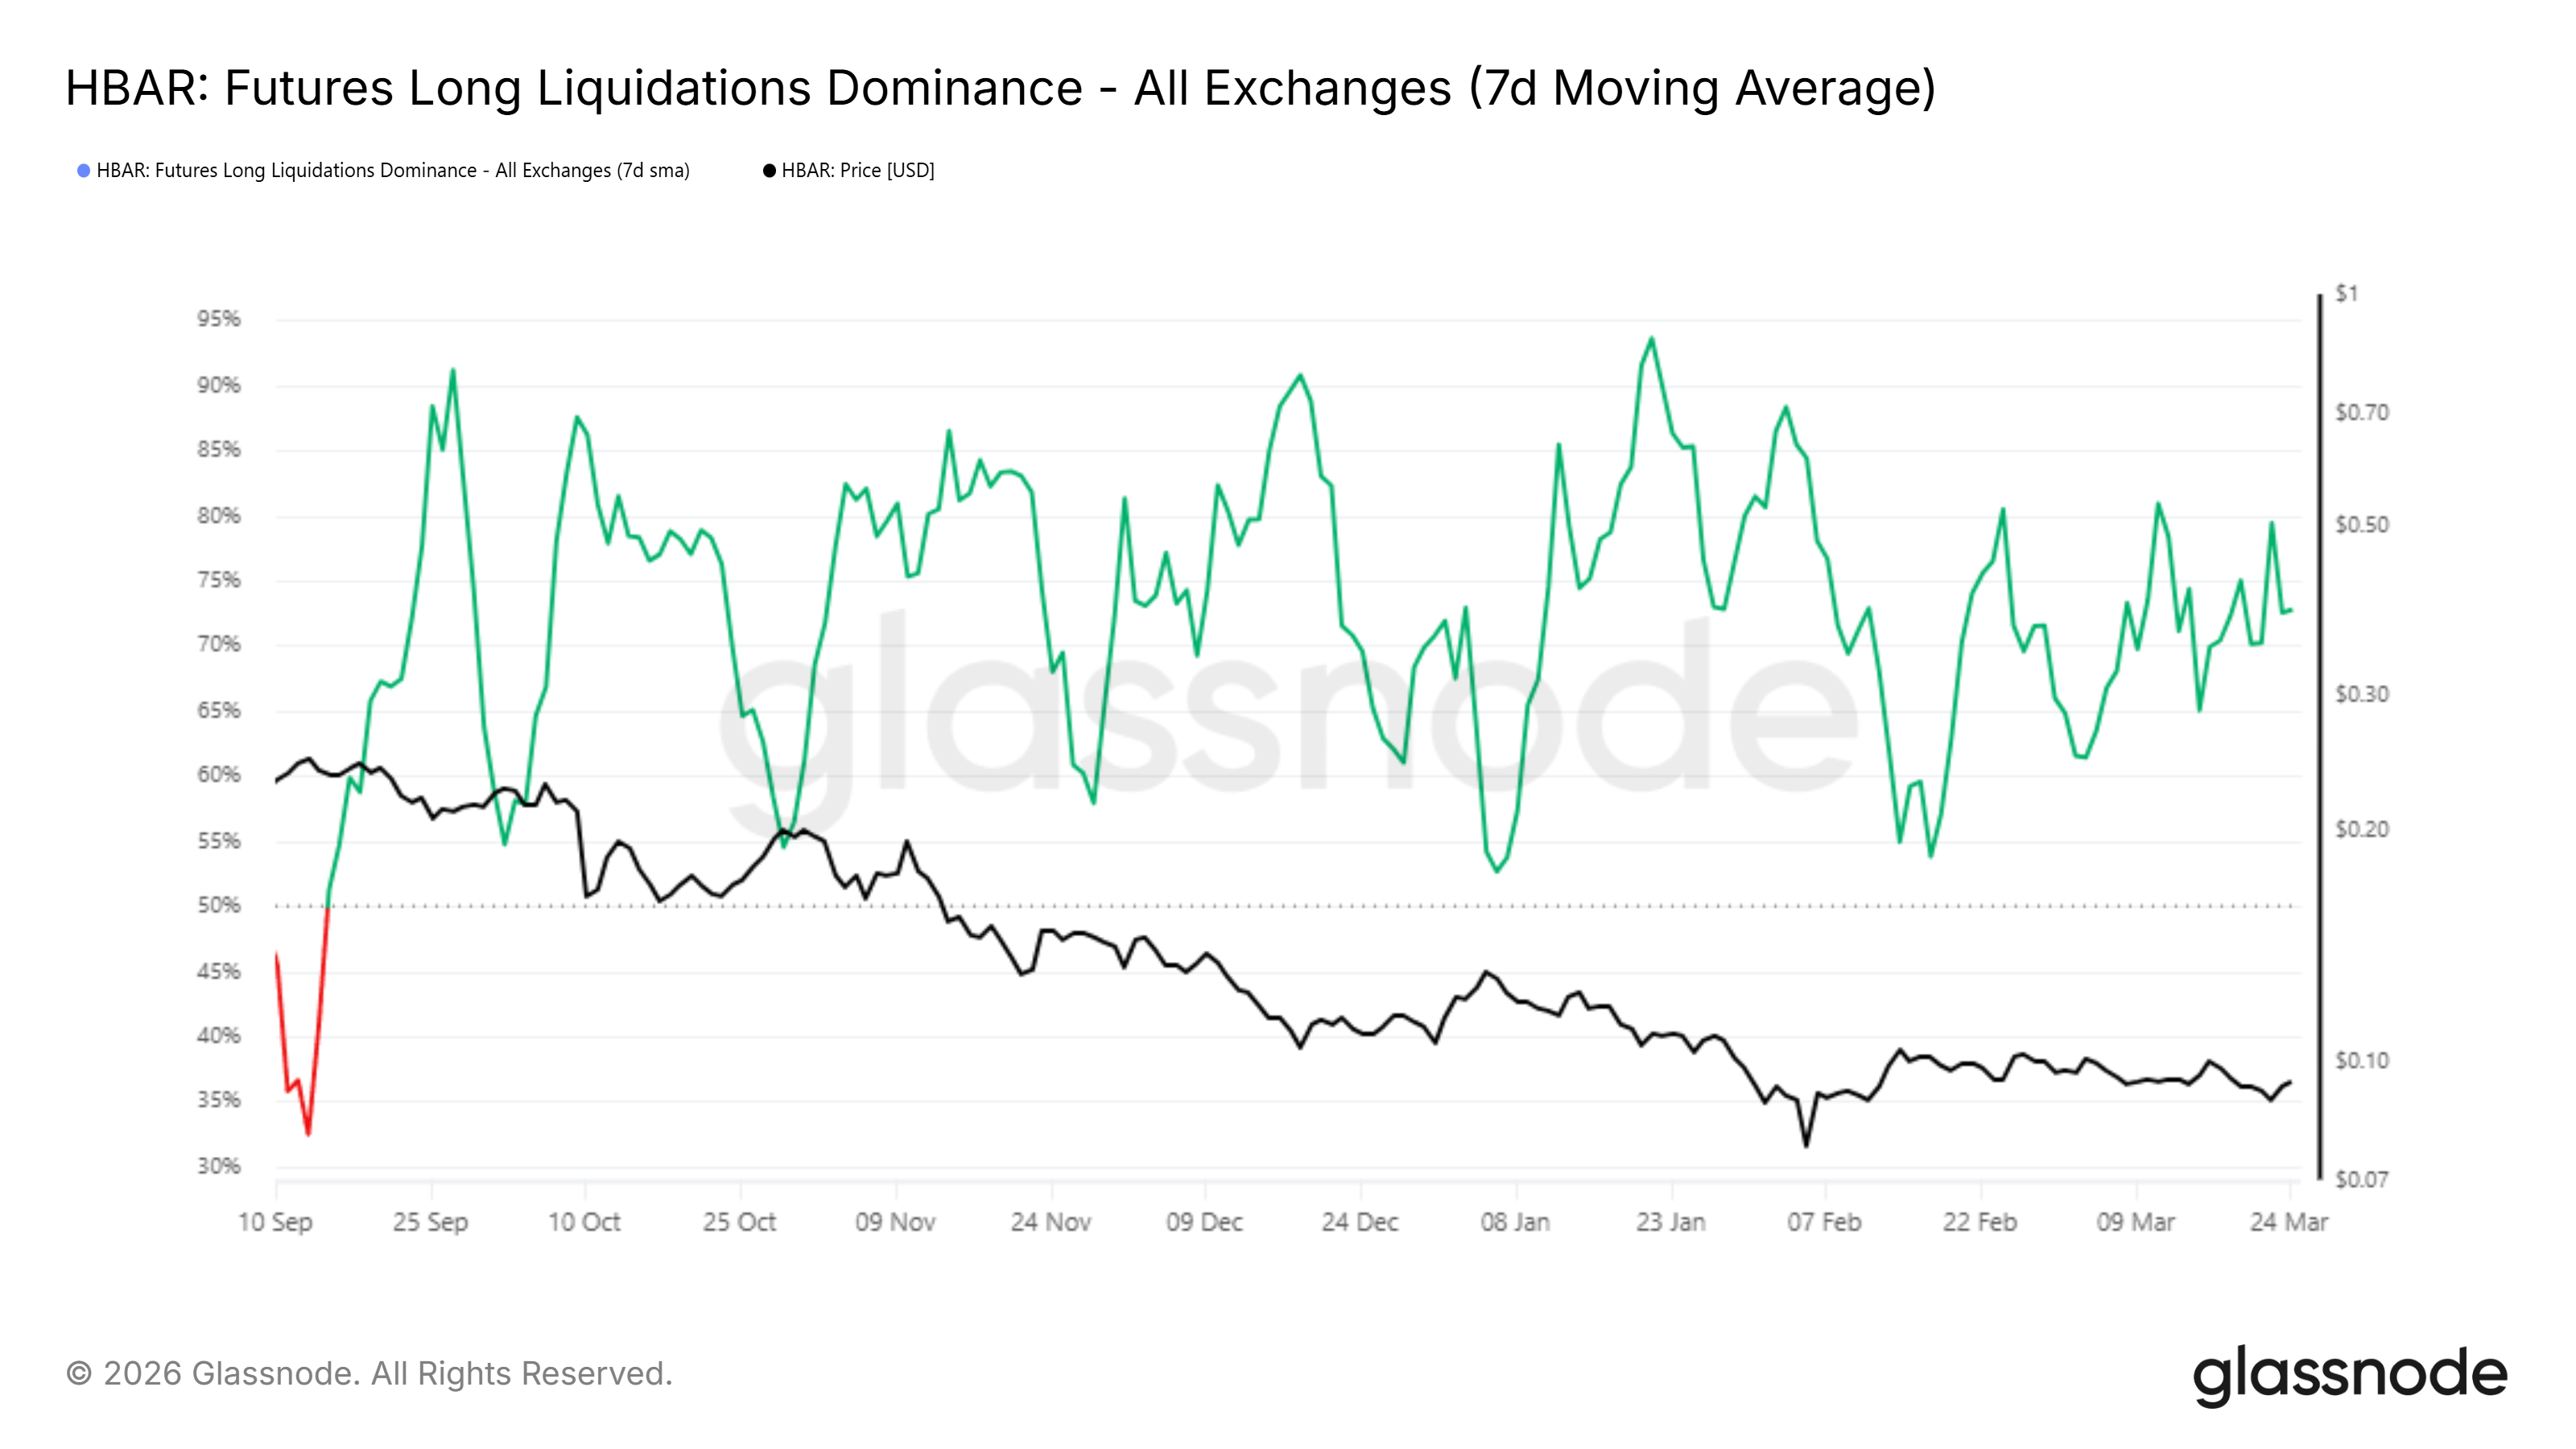
The futures long liquidations dominance chart for $HBAR spans from September 2025 through March 25, 2026. Over that entire period, the 7-day moving average has remained above the 50% threshold on almost every trading day.
Long liquidation dominance above 50% means forced closures of long positions are consistently outpacing short liquidations. This is a structural pattern, not a one-off event. Every time price staged a relief rally, the metric spiked higher, reaching peaks near 90% in late September and again in December and January.
 $HBAR Futures Long Liquidation Dominance">
Those spikes coincided with price drops, confirming that overleveraged longs were repeatedly getting caught and forced out.
As of March 25, the metric sits near 80% with $HBAR priced around $0.09. The pattern from the past six months gives no indication of a regime change.
$HBAR’s Capital Is Only Leaving
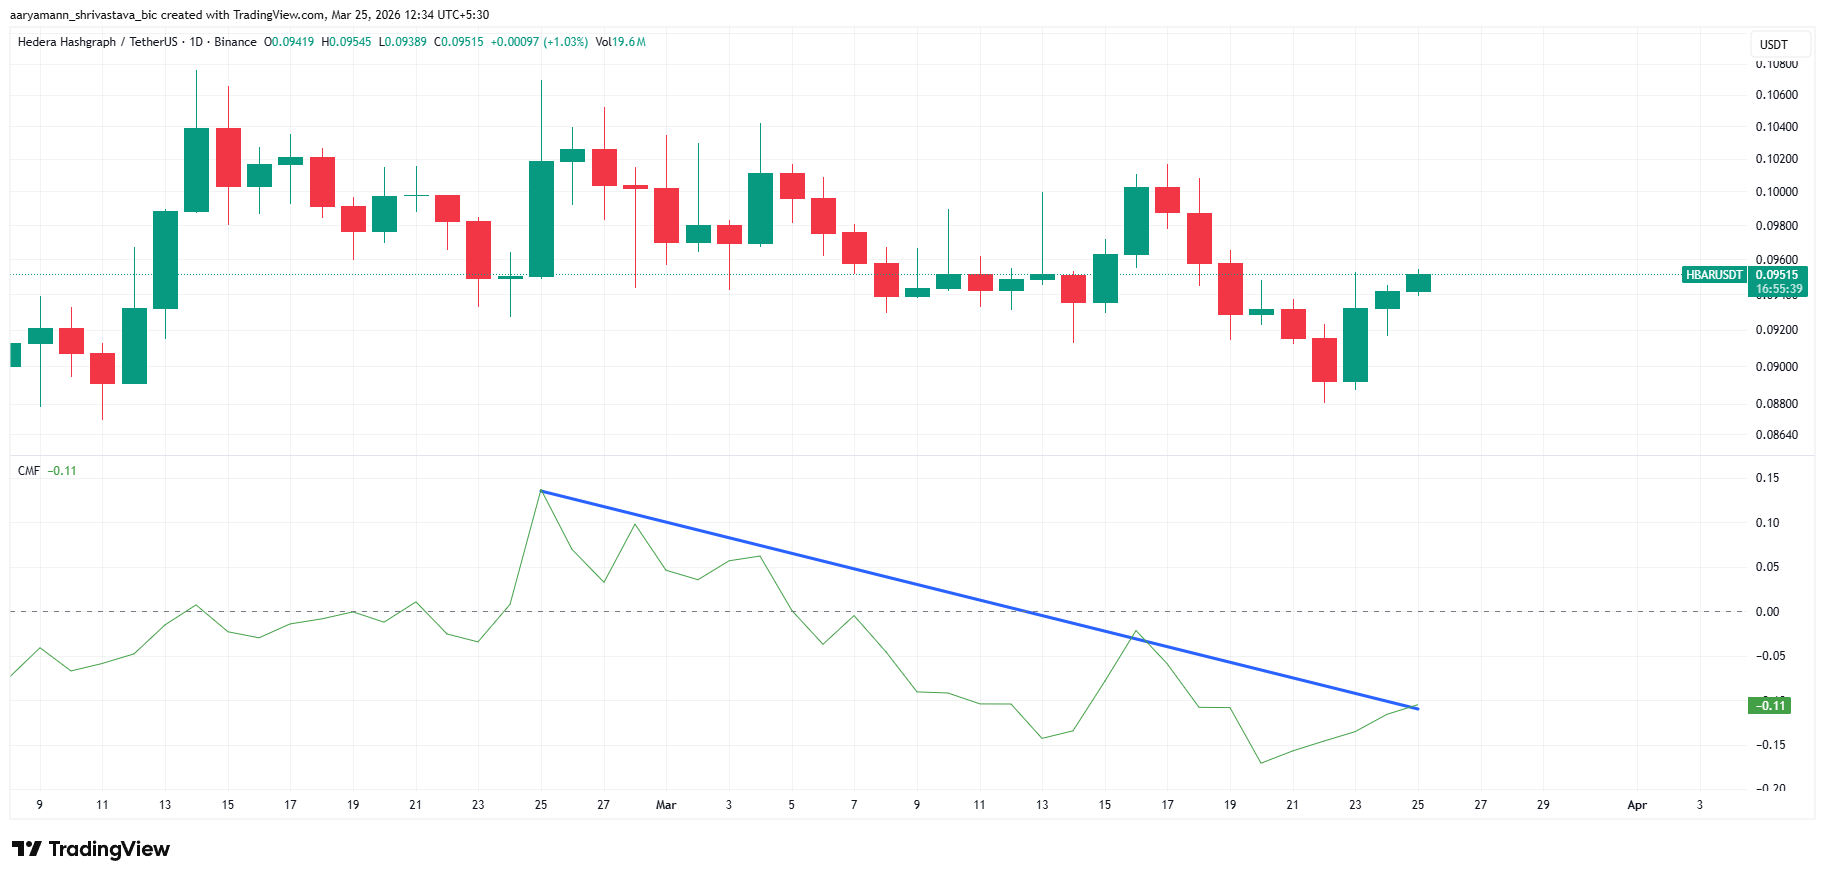
The Chaikin Money Flow (CMF) on the daily chart reinforces the liquidation picture. After briefly touching 0.13 in late February, CMF has declined in a straight line, dropping to -0.11 as of March 25.
A negative CMF reading means selling volume is outweighing buying volume on a net basis. The current reading of -0.11 is not a mild dip below the zero line. The descending trendline drawn from the February peak shows no flattening or base formation. Capital is leaving $HBAR consistently, and the rate of exit is accelerating.
Want more token insights like this? Sign up for Editor Harsh Notariya’s Daily Crypto Newsletter here.
 $HBAR CMF">
For context, the price action during this same period has been flat to slightly lower. That combination, falling CMF alongside a price that cannot recover, signals that any buying activity is being absorbed by sellers rather than driving meaningful upside.
CMF would need to cross back above zero and hold there before the demand picture changes.
How Do $HBAR Holders Feel?
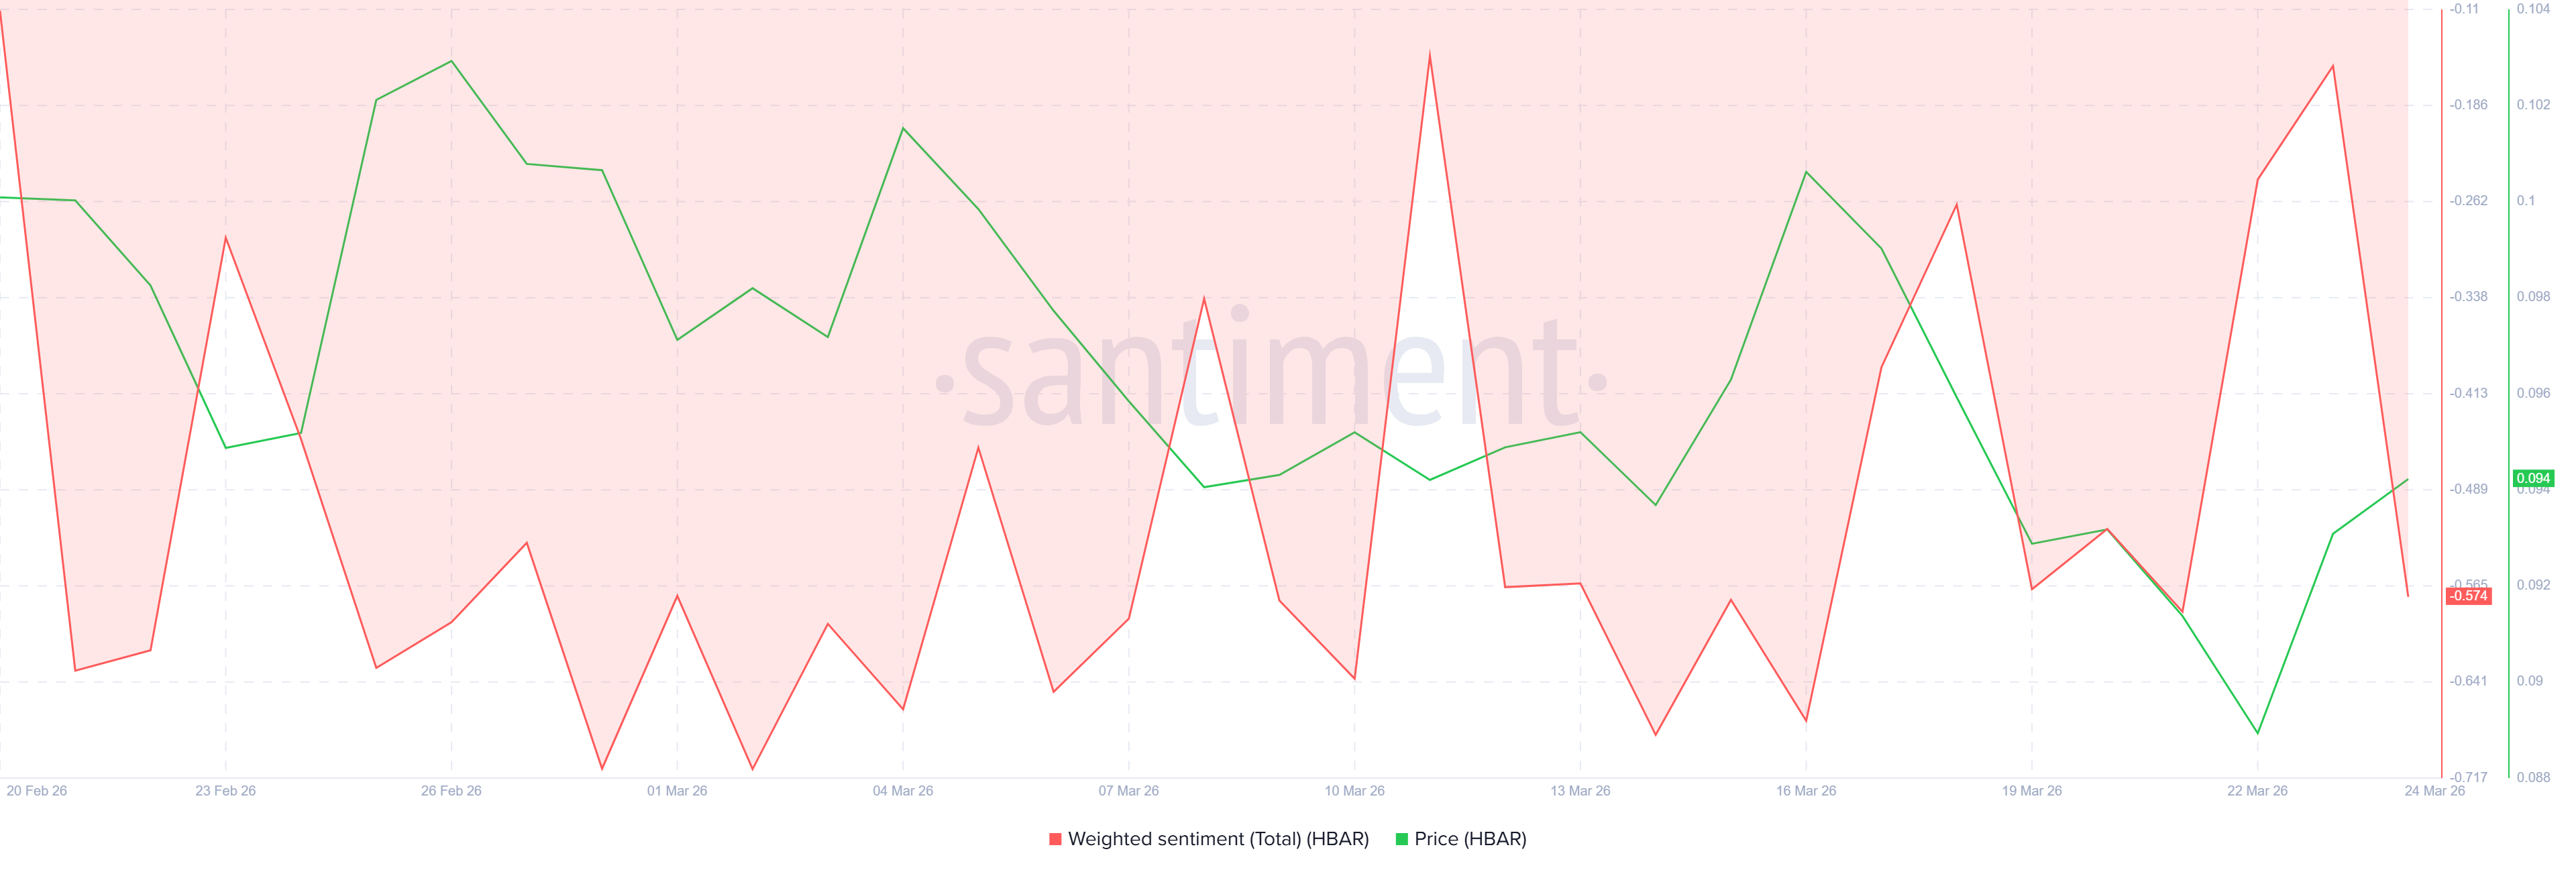
The Santiment weighted sentiment chart for $HBAR shows the social and narrative backdrop since February 20. The weighted sentiment reading has spent the overwhelming majority of that period in negative territory, closing March 25 at -0.574.
A weighted sentiment below zero means more negative commentary than positive is circulating on social platforms and media relative to historical norms. The reading has not sustained a positive print for more than a day or two before reverting lower.
 $XRP Weighted Sentiment">
Even during the mid-March period when the price briefly bounced above $0.10, sentiment failed to confirm the move, suggesting buyers were not building conviction.
That absence of narrative support matters. Recoveries in altcoins often require a sentiment catalyst to sustain buying momentum. With sentiment at -0.574, no such catalyst is forming.
$HBAR Price May See a Decline
The daily price chart shows $HBAR trading under a descending resistance. The 20-day exponential moving average sits at $0.0982, and the 50-day is at $0.1322. Both moving averages are sloping downward and sitting well above the current price, reinforcing the bearish structure.
The nearest support levels are $0.0930 and then $0.0886. $HBAR is already pressing into the $0.0930 zone. A close below this level opens the door to $0.0886.
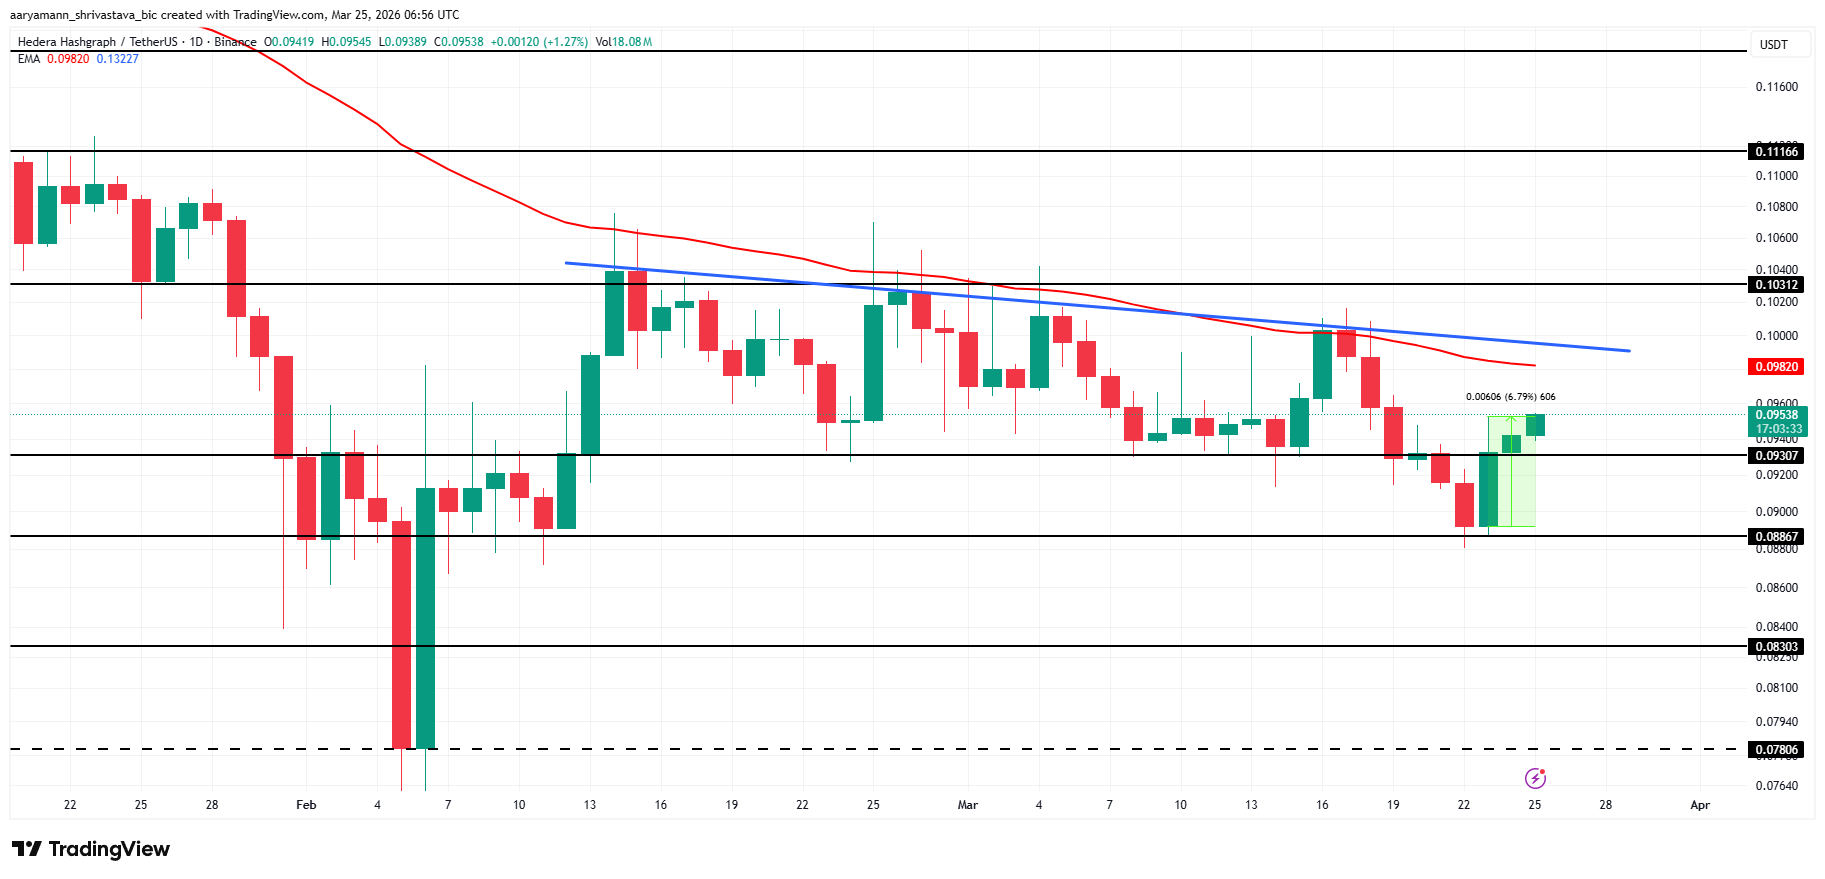 $HBAR Price Analysis. ">
Below $0.0886, the next support sits at $0.0830, with $0.0780 as the floor visible on the chart. Given the six-month run of long liquidation dominance, any sharp move lower could accelerate as leveraged longs positioned near current prices get swept out.
The thesis reverses only if $HBAR breaks and closes above $0.1031, the nearest horizontal resistance. Above that, $0.1166 becomes the target. A sustained close above $0.1031, combined with CMF turning positive, would signal that the six-month bearish structure is breaking down. Until then, the same pattern that has defined $HBAR since September 2025 remains intact.
The post 6 Months of $HBAR Long Liquidations — The Worst May Not Be Over appeared first on BeInCrypto.