
Dogecoin is recovering, but mixed trend signals and nearby resistance show buyers still need stronger momentum to confirm upside.
Dogecoin is changing hands around $0.09663, up 1.64% on the day after rebounding from an earlier dip below $0.093. The one-day chart shows $DOGE spending much of the previous session under pressure before recovering steadily.
It has since reclaimed the $0.09507 level and is pushing toward the $0.097 area. That move suggests buyers regained short-term control, with the latest price action favoring a near-term recovery narrative.
The wider market data still shows a mixed backdrop. Dogecoin is up over the 4-hour, 24-hour, and 30-day periods, but remains down over the 7-day, 90-day, and 1-year timeframes. At the same time, it has recorded $1.08 billion in open interest and $2.32 billion in futures volume.
Notably, this supports the view that $DOGE may try to hold its rebound if buying pressure remains intact.
Can Dogecoin Hold Its Rebound?
Dogecoin’s daily chart shows a modest recovery, with $DOGE trading above $0.09 after rebounding from the $0.089 area. The recent candles suggest buyers have regained some short-term control, but the Parabolic SAR still sits above the price at around $0.1035.
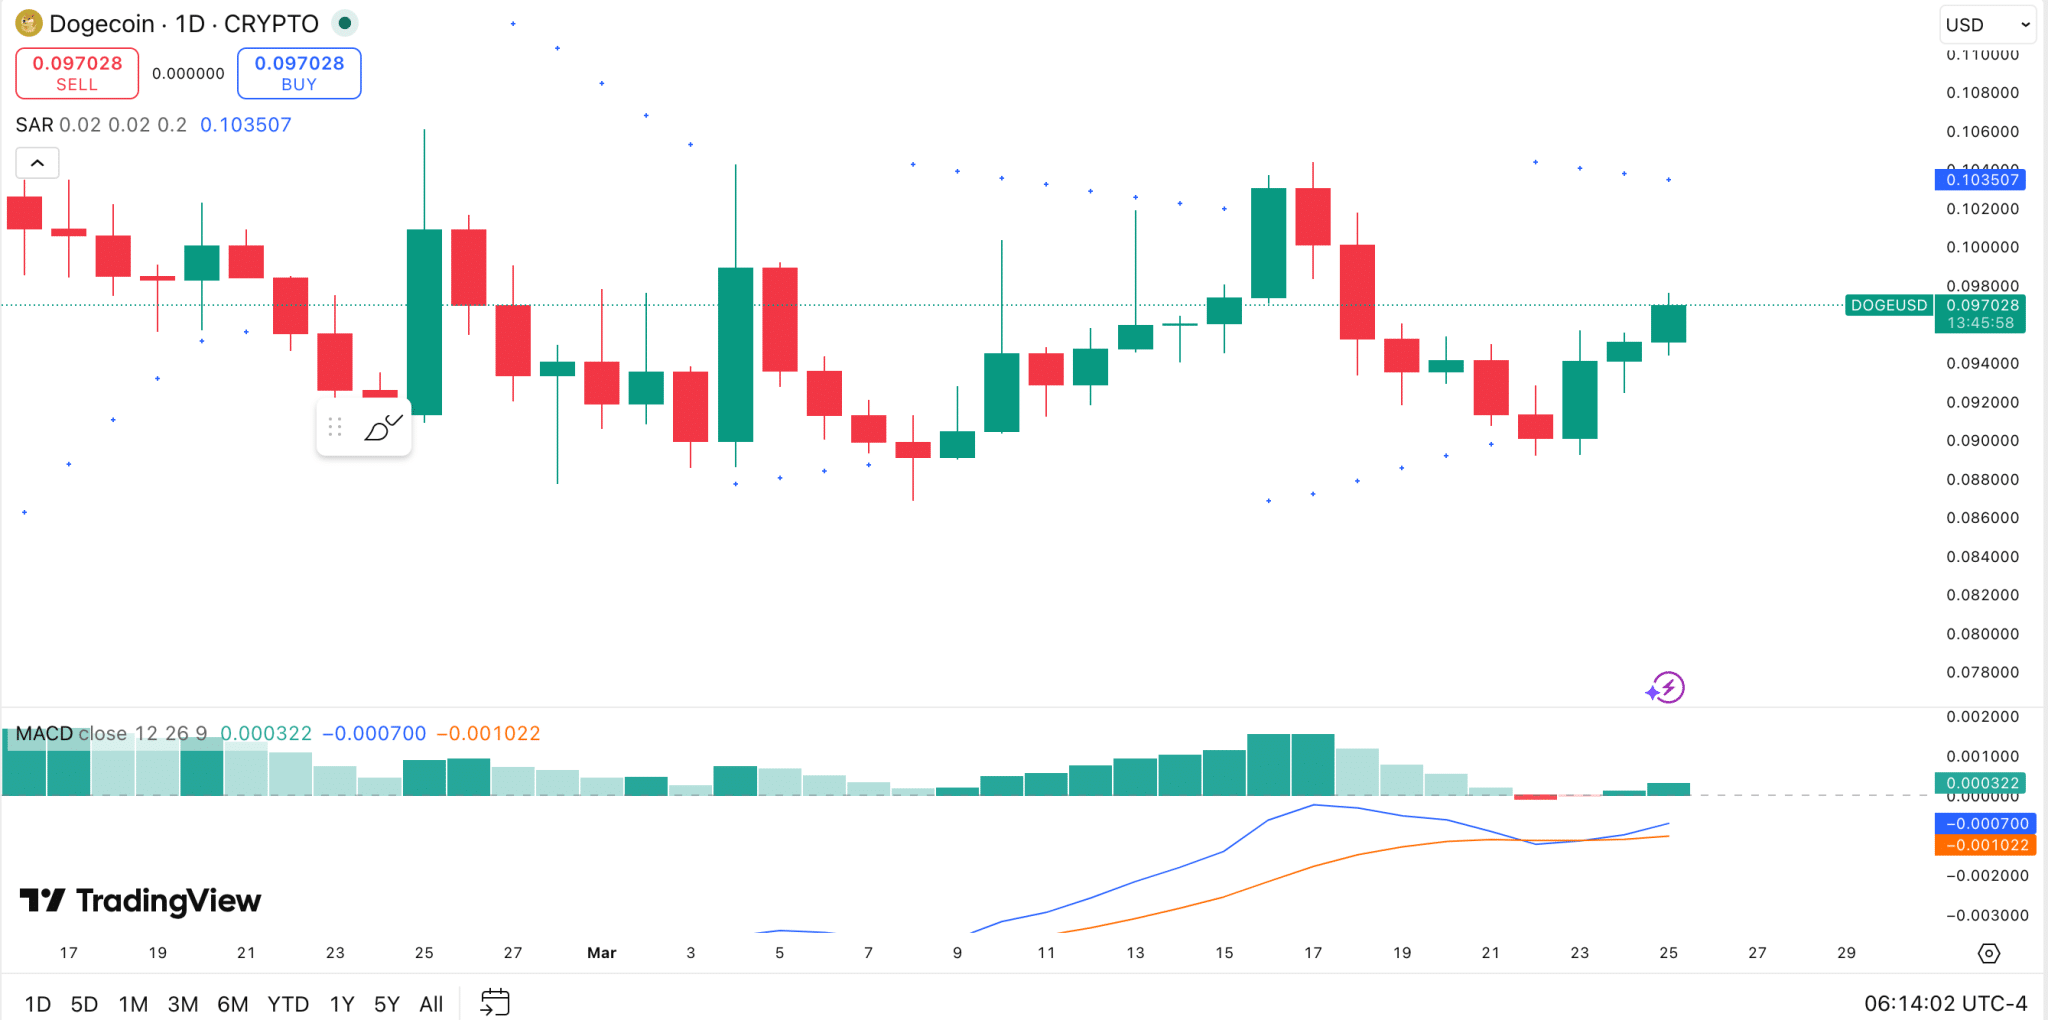
This typically means the broader daily trend has not fully turned bullish yet. In technical terms, $DOGE is recovering, but it still needs a stronger push above the Parabolic SAR resistance to confirm a full trend reversal.
The MACD paints a more constructive near-term picture. The histogram has turned positive, while the MACD line (-0.000700) has moved above the signal line (-0.001022). This points to improving momentum and fading bearish pressure.
Even so, both lines remain below the zero line, which suggests the rebound is still in its early stages rather than a confirmed breakout. For now, traders may view $0.089 as near-term support, while the SAR zone near $0.1035 stands out as the next resistance level.
Is This the Next Leg for Dogecoin?
On the social media commentary end, Trader Tardigrade said Dogecoin’s 4-hour chart is showing a constructive setup, with the price action forming the right shoulder of an inverse head and shoulders pattern.
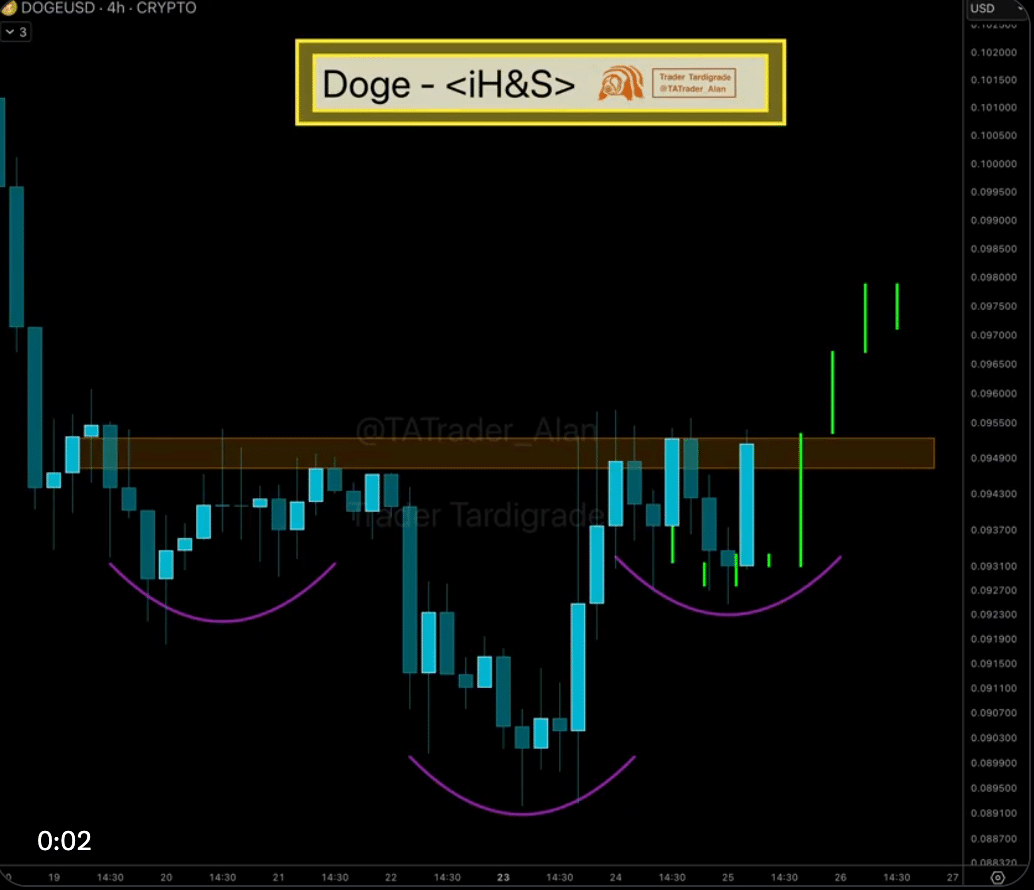
In technical analysis, that structure is often seen as a potential bullish reversal signal, especially when the price begins to stabilize and climb after forming the head.
The analyst said the next key step is a break above resistance, which appears near the highlighted neckline zone on the chart. If $DOGE clears that level, Trader Tardigrade said $0.098000 could become the next price area to watch.