Shiba Inu is forming a bullish divergence on the daily timeframe, and this could result in a double-digit price expansion in the coming weeks.
The positive formation follows a string of upward price movement on the daily chart. Shiba Inu ($SHIB) is now on course for the third consecutive green candlestick on the 1-day chart, during which it has bounced 9% from recent lows.
Key Points
- Shiba Inu is forming a divergence on the daily timeframe, with prices making lower lows while the RSI indicator made higher lows.
- This divergence has occurred twice in recent months, with the first between December 18 and 31 and the most recent between February 5 and March 8.
- The first target should bullish momentum return is the last lower high peak at $0.00000725, with the subsequent target being the 200 MA at $0.00000864.
- Adding to this bullish outlook is Shiba Inu’s recent break above the 50-day exponential moving average.
Shiba Inu Bullish Divergence
A look at the daily chart shows a developing bullish divergence between the relative strength index (RSI) and $SHIB’s price. While prices made lower lows, the indicator made higher lows, a divergence that usually signals market strength despite dwindling prices.
Interestingly, this divergence has occurred twice already in recent months. The first instance was between December 18 and 31, when the RSI made higher lows from 29 to 34, while $SHIB dropped from $0.00000753 to $0.00000682. This sparked a strong price surge, with Shiba Inu rallying over 22% in days to January’s high of $0.00001009.
The most recent occurrence happened between February 5 and March 8. The RSI trended upwards from oversold levels of 23.7 to 33.7, but prices diverged, dropping from the opening of $0.00000663 to $0.00000523.
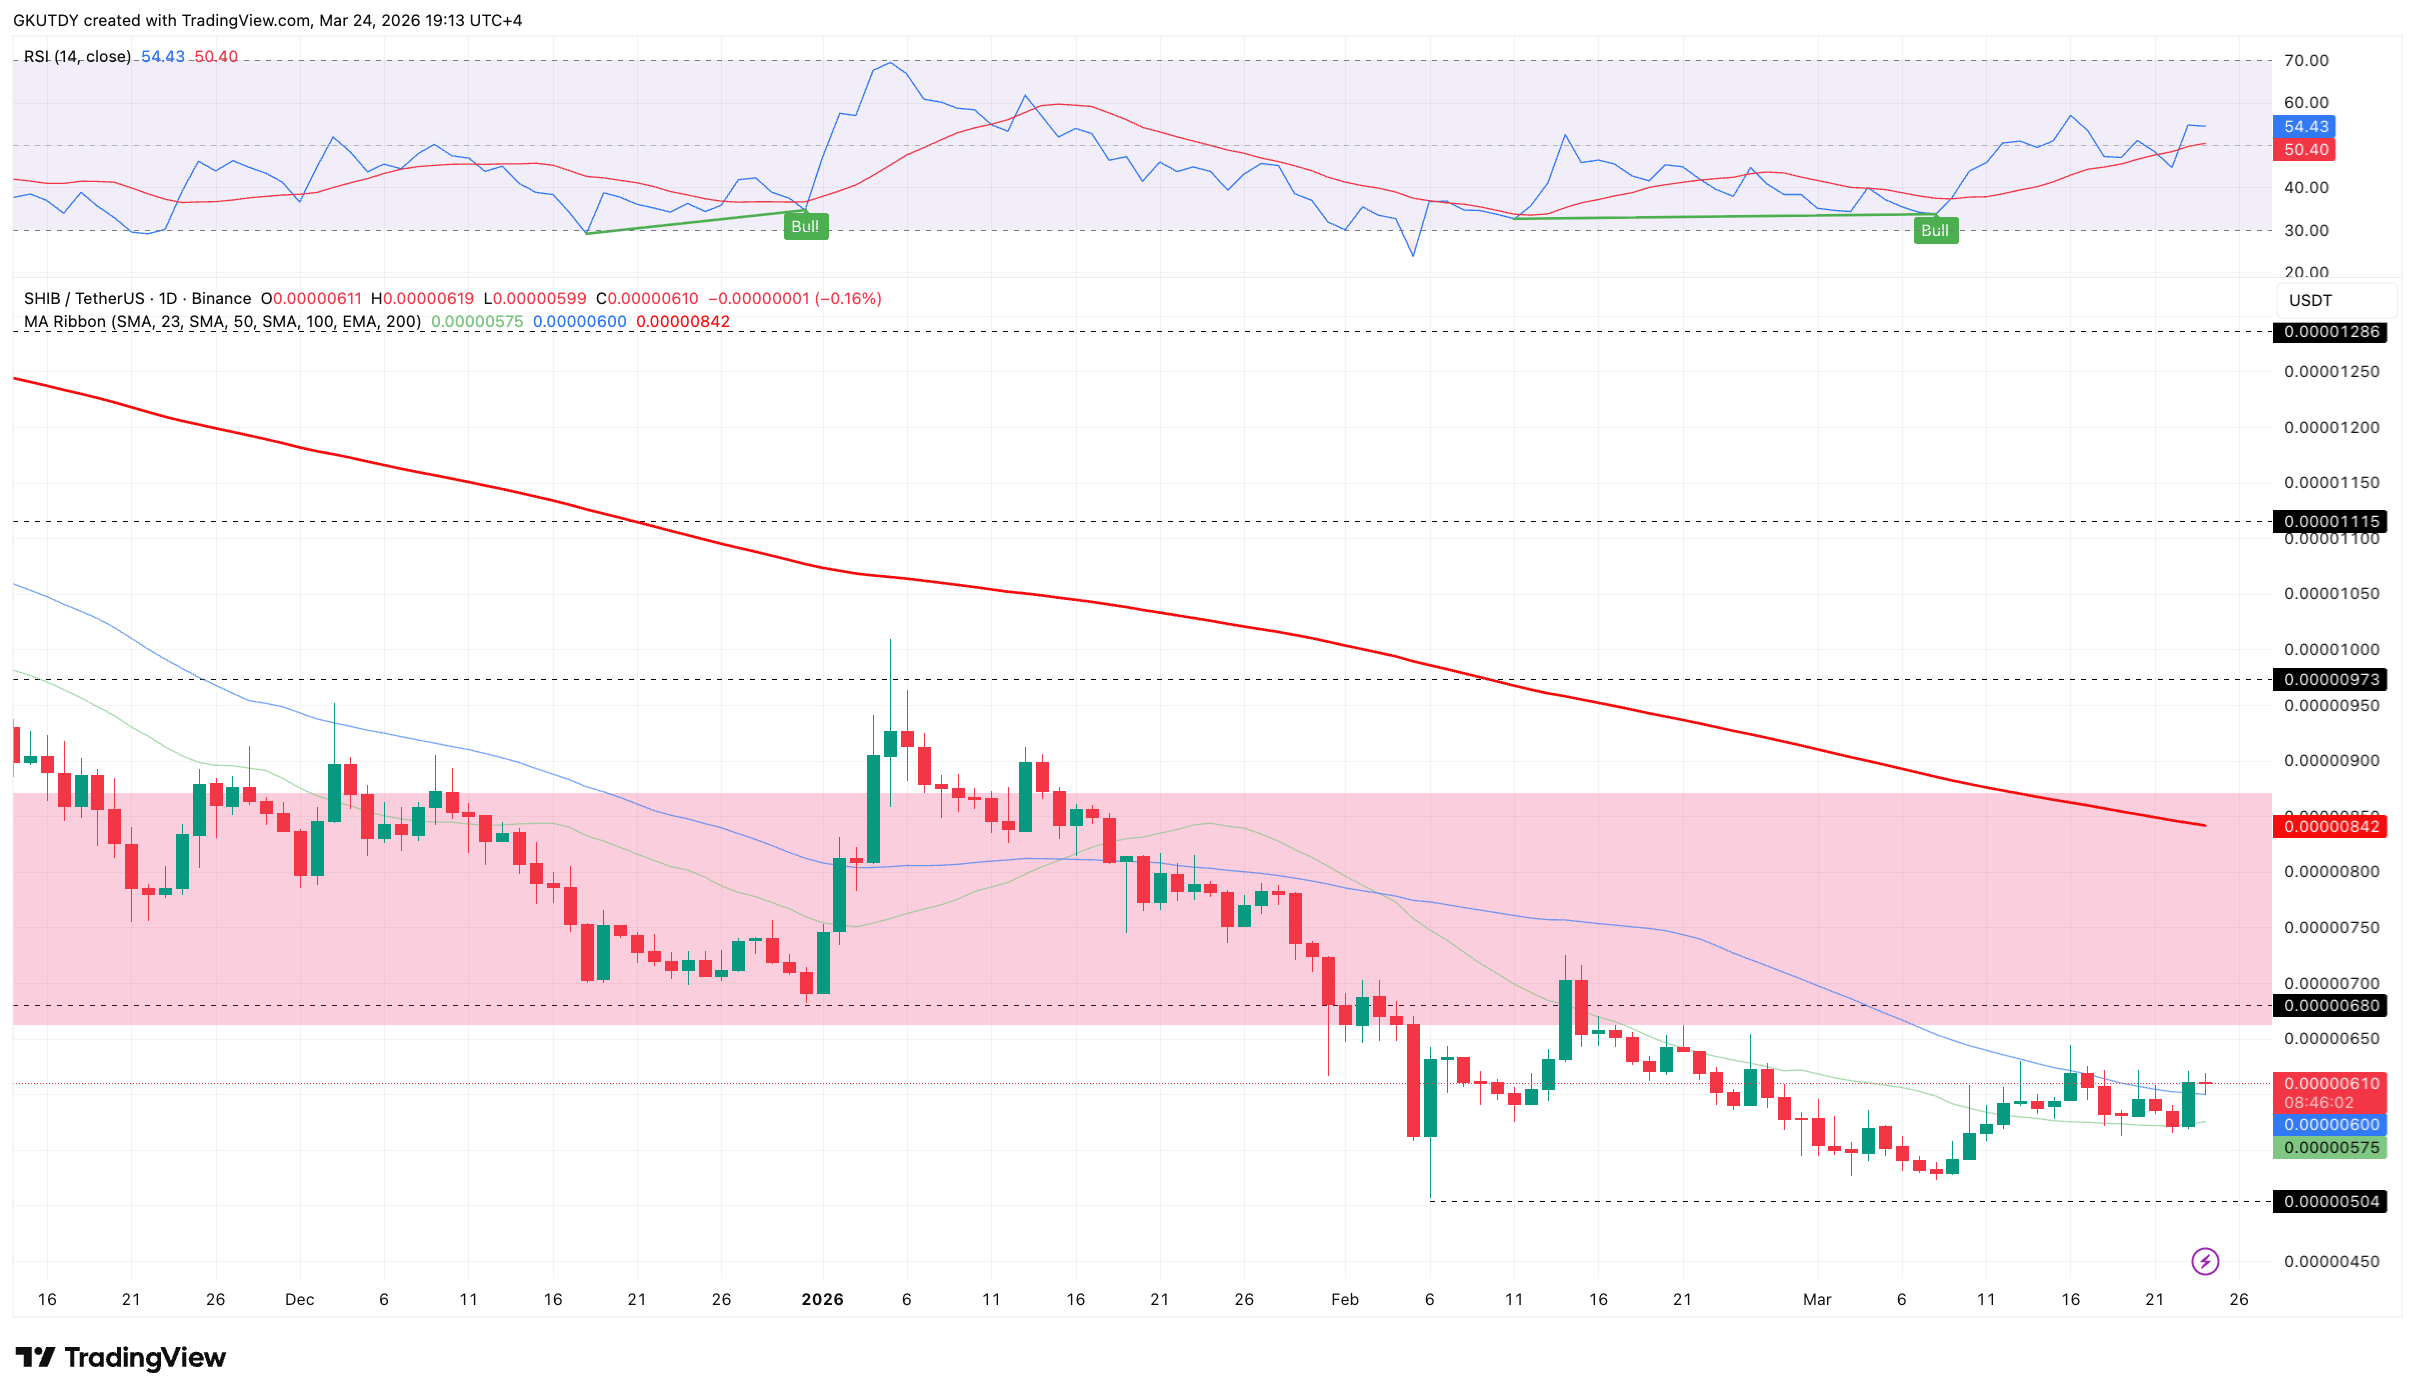
Moreover, $SHIB has held above the key support level around $0.00000504. It reached the zone on February 6, and a drop near the area at $0.00000523 earlier in the month was met with a strong rebound. A combination of this divergence and momentum from holding support could push $SHIB much higher.
Specifically, the first target would be the last lower high peak at $0.00000725, representing a 16% increase. Subsequently, $SHIB could rally to the key 200-day simple moving average. Currently, this indicator is at $0.00000864, culminating in a 38% rise from here.
Potential 50-Day EMA Breakout Adds to Bullish Prospect
Adding to this bullish outlook is Shiba Inu’s recent break above the 50-day exponential moving average. With minimal noise, the token defied this resistance following its two-day bullish haul.
The 50 EMA is key to price trends, as it serves as a major boundary between downtrends and uptrends. Holding above it paves the way for further price rallies.
Currently at $0.00000619, the 50 EMA trends below the current price of $0.00000624. It all boils down to maintaining the trend above this trendline, as doing so would set the pace for higher prices.
Shiba Inu also remains above key moving MAs, which is a positive sign. The token’s price is above the 50 MA and 23 MA, providing strong support for further price trends.