The $XRP Realized Volatility indicator on Binance has reached its lowest level this year, suggesting that a sharp move may be imminent.
Following the downward push that has resulted in a 20% decline for $XRP this year, bulls have started defending $XRP around the $1.4 level, cushioning steeper declines.
However, new data suggests that a major move could be approaching, as the Realized Volatility on Binance over the past 30 days has dropped to its lowest reading since the start of 2026.
Key Points
- $XRP’s 30-day realized volatility on Binance has dropped to around 0.52, marking the lowest level in 2026.
- Data shows that a similar drop in volatility in January 2026 led to a 31% rally from $1.84 to $2.41 in five days.
- In contrast, another low-volatility period in October 2025 preceded a decline from $2.88 to $2.19, showing that moves can occur in either direction.
- $XRP’s Bollinger Bands and Historical Volatility metrics have begun recovering after similar declines.
- $XRP has formed higher lows from $1.1 in early February to $1.36 in late March, suggesting growing buyer support despite the uncertain outlook.
$XRP Volatility Compression Points to a Coming Move
Arab Chain, a verified analyst on CryptoQuant, revealed these findings in a recent market commentary. According to him, the Binance $XRP Realized Volatility (30D) has declined sharply, indicating that the price has moved less over the past month.
For the uninitiated, this indicator tracks how much the price of $XRP changes on Binance over a 30-day period, and its current level shows that the market is currently calm in comparison to other periods. At 0.5266, the 30-day realized volatility sits lower than the levels seen earlier in 2026 when prices were more active.
Moreover, Arab Chain also highlighted the Volatility Z-Score, which now stands at -0.9048. This negative value further confirms that current volatility is well below its usual range. Essentially, the market has slowed down, and prices are moving within a tight range.
The analyst called this concept “volatility compression,” where the market pauses before making a bigger move. The current $XRP price of around $1.4 suggests that buyers and sellers have reached a balance.
However, such a balance usually does not last long. Arab Chain noted that once volatility starts to rise again, especially if the Z-Score turns positive, the chances of a strong move increase. That move could go either upward or downward, depending on which side takes control.
Historical Data
Historical data confirms this trend. Arab Chain’s chart shows that when realized volatility dropped to similar levels as before, $XRP often made strong moves soon after. For instance, at the start of January 2026, a drop in volatility came before a quick rally. Specifically, $XRP rose from $1.84 on Jan. 1 to $2.41 by Jan. 6, gaining 31%.
A different outcome appeared in early October 2025. After a similar drop in volatility, $XRP moved lower, falling from $2.88 on Oct. 9, 2025, to $2.19 by Oct. 17, 2025. This decline marked the beginning of the ongoing downtrend and confirmed that a drop in volatility could lead to a sharp move in either direction.
Meanwhile, another case occurred in early July 2025, when low volatility came before a strong rally. Notably, $XRP jumped from $2.17 on July 2, 2025, to its all-time high of $3.6 on July 18, 2025. Now that volatility has fallen again, $XRP could soon see a sharp rise or drop.
Bollinger Bands Show Volatility May Be Returning
Elsewhere, on the daily chart, Bollinger Bands recently tightened to levels last seen before the January 2026 rally. This tightening usually means the market is quiet, but it often comes before stronger price action. Recently, the bands have started to widen slightly, suggesting that volatility may be picking up again.
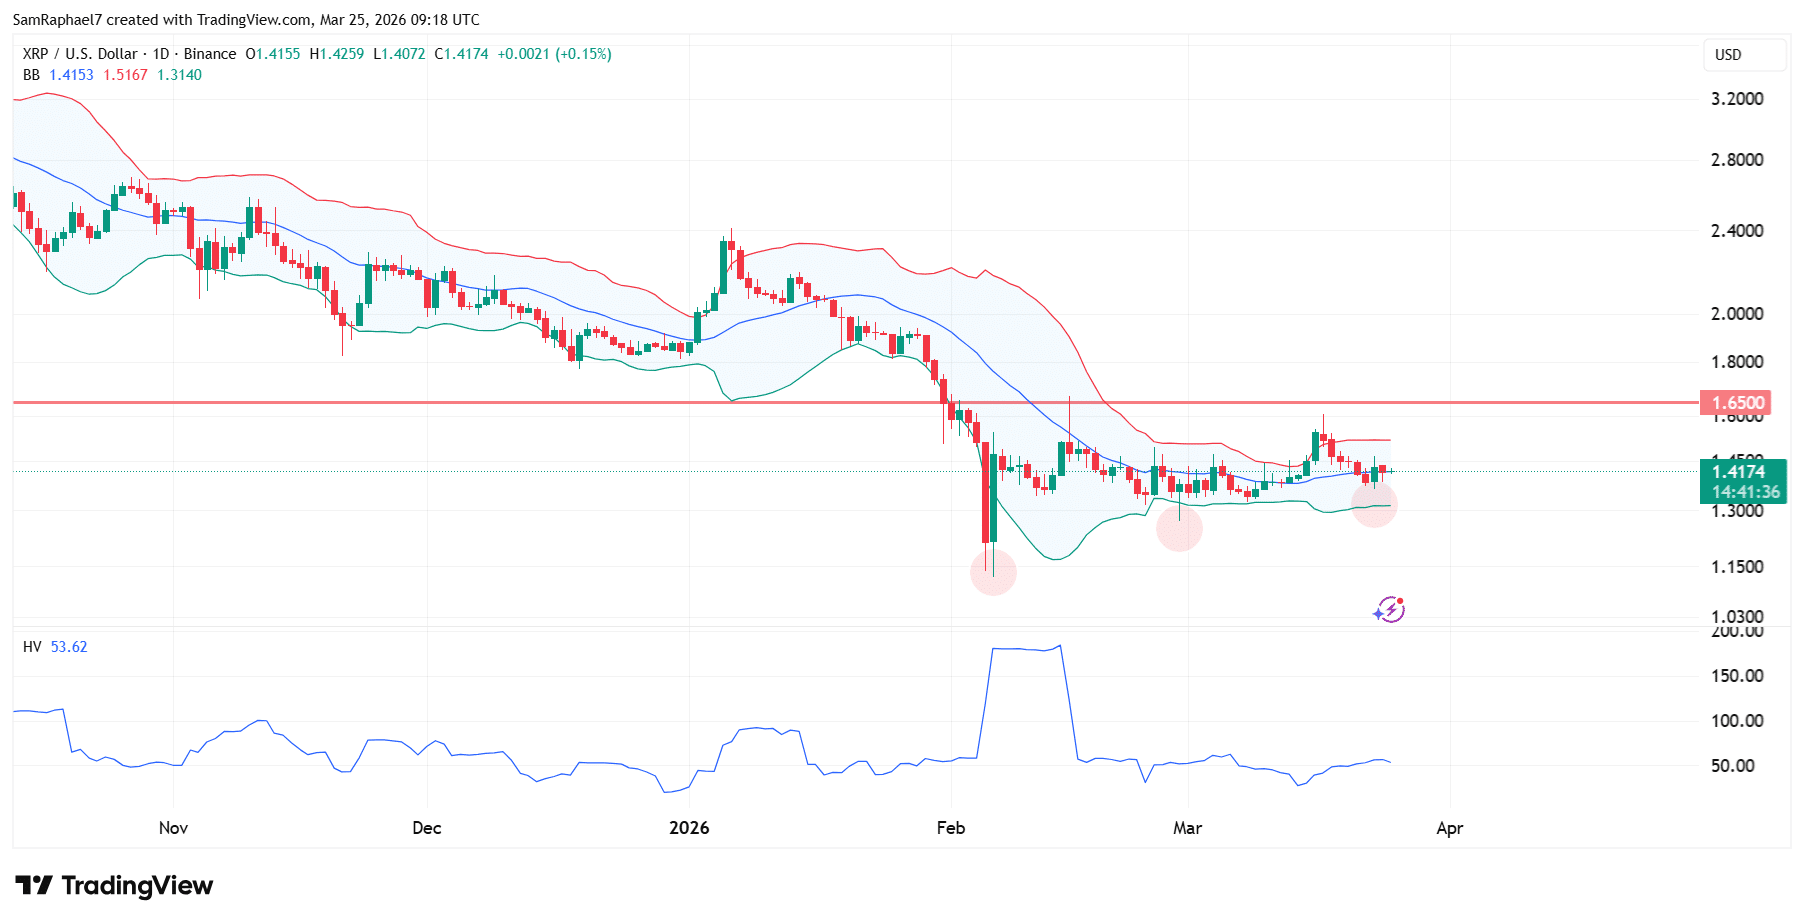
The Historical Volatility indicator also supports this. Specifically, it recently dropped to 27.57, its lowest level this year, before rising to 53.62. This increase shows that price movement is starting to return, but the direction of the sharp movement remains unclear.
However, data shows that since dropping to $1.1 on Feb. 6, $XRP has been forming higher lows. From that level, it dropped to a floor of $1.27 on Feb. 28, then to $1.36 on March 23. This pattern shows that buyers are stepping in earlier each time the price dips. This gradual rise in support levels suggests growing interest from buyers.