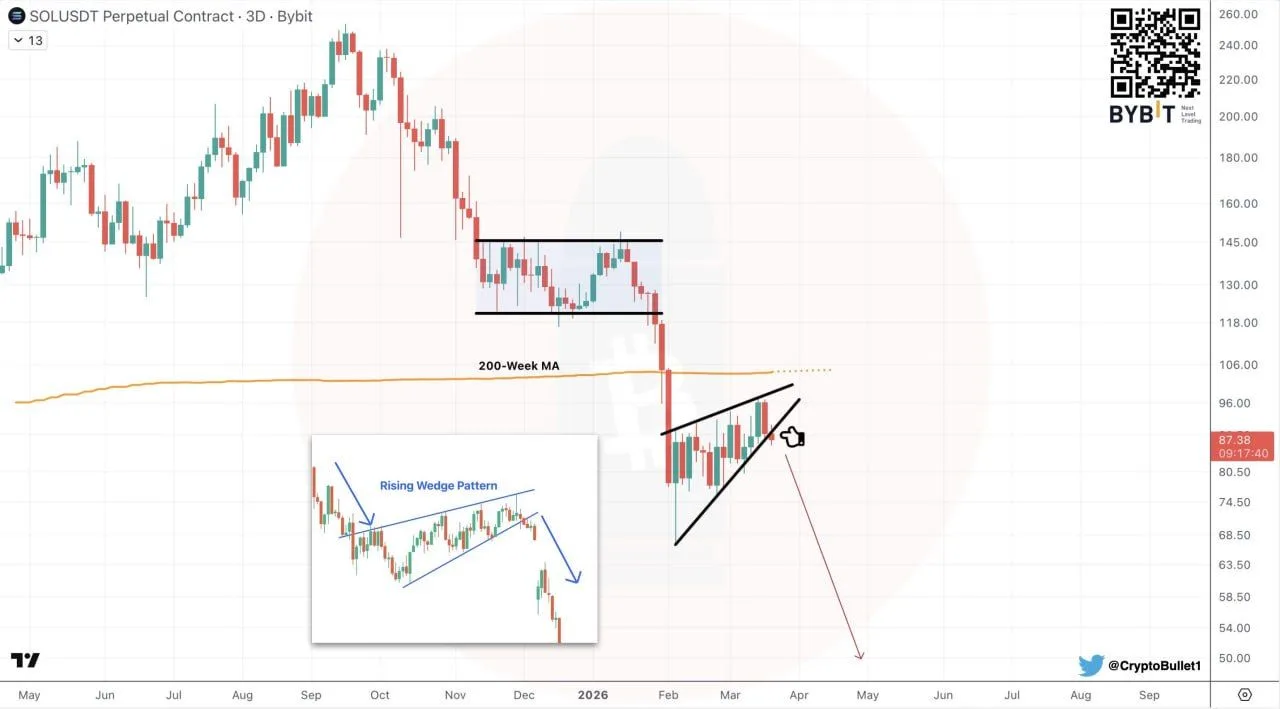
Solana Rising Wedge Pattern. Source: CryptoBullet
Since that breakdown, Solana has rebounded inside a narrowing upward channel, which CryptoBullet identifies as a rising wedge. In technical analysis, that pattern often points to weakening momentum during a recovery move, especially when it forms after a strong drop. As a result, traders often treat it as a potential continuation setup rather than a bullish reversal.
CryptoBullet wrote that the rising wedge “looks horrendous” and said it will most likely resolve to the downside. The chart also includes a projected move lower from the wedge, reinforcing the view that Solana could face another leg down if support gives way.
For now, the wedge structure remains the key feature to watch. If price breaks below the lower trendline, the pattern would strengthen the bearish case and suggest the rebound has ended. Until then, the chart shows Solana attempting a recovery, but still inside a formation that often breaks lower in downtrends.
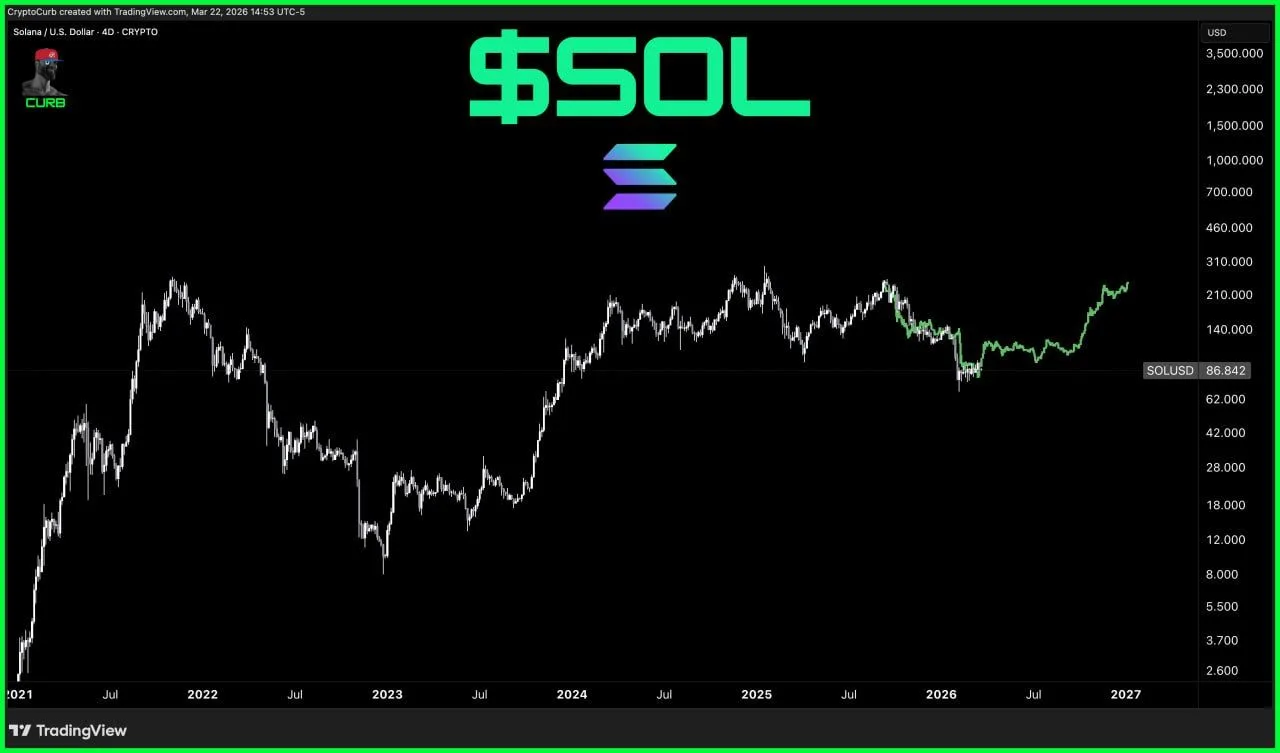
Solana Chart Maps Possible Recovery Path for Rest of 2026
A chart shared by CryptoCurb outlines a possible bullish path for Solana through the rest of 2026, showing the token stabilizing after its early 2026 drop and then gradually moving higher into year end.
The 4 day chart presents a projected scenario rather than a confirmed breakout. In the visual, Solana first moves through a choppy consolidation phase, then builds momentum and trends upward into late 2026. The forecast suggests a recovery from the recent weak period instead of another leg lower.
Solana 2026 Recovery Projection. Source: CryptoCurb
The chart also places this potential move in a broader multi year context. Solana previously saw large swings between 2021 and 2025, including sharp rallies, deep corrections, and repeated recovery attempts. Against that backdrop, the projected path implies the market may be trying to rebuild structure rather than stay locked in a prolonged downtrend.
CryptoCurb described the setup as a “possibility for rest of 2026,” which keeps the view conditional. That matters because the chart does not show a confirmed trigger level or breakout signal. Instead, it sketches a scenario in which Solana regains strength over time if the broader recovery holds.
For now, the main takeaway is that the chart reflects a constructive medium term outlook, but not a confirmed move. Solana would still need to sustain higher lows and continue recovering through the coming months for that projected path to remain credible.

 coinpaper.com