Normally, strong breakouts in price prefer rising volume for conviction. Thus, the drop in trading volume suggests low interest in Dogecoin by both retail and institutional players.
When sentiment drops, it usually impacts the price of digital assets negatively. Also, the lack of traction and continuous price weakness is attributed to the current drop in market participation.
However, in Bollinger Bands theory, a breakout after a period of compression can still be valid even on lighter volume. It often reflects reduced selling pressure rather than aggressive buying, as witnessed in previous cycles.
It means sellers have stepped back, allowing buyers to push prices higher with less resistance. This setup frequently leads to sustained uptrends once the breakout is confirmed.
Bullish bias on Dogecoin's four-hour chart
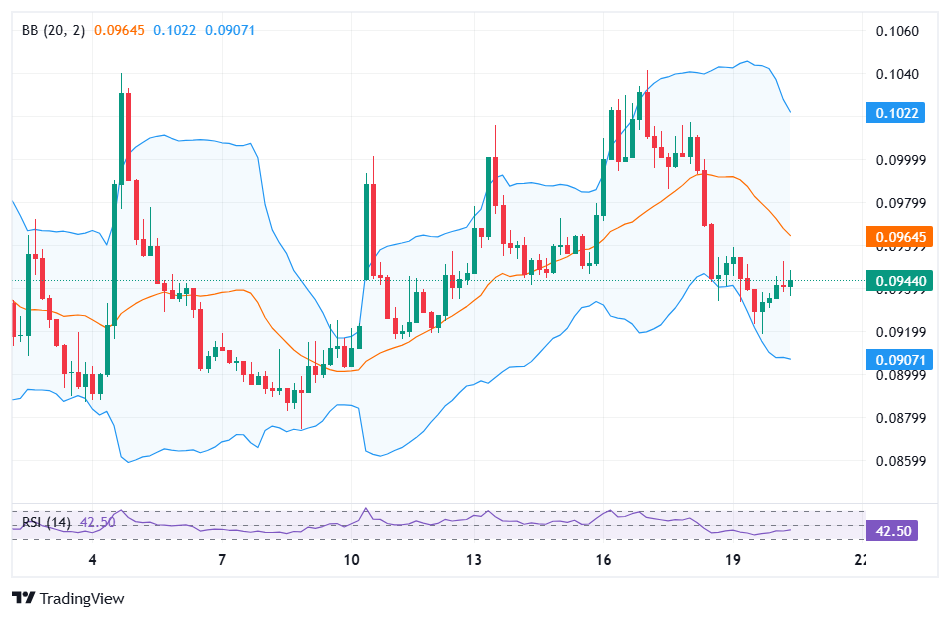
Notably, Dogecoin has displayed a clear upward price trend on the four-hour candles, as the Bollinger Bands expand. Since mid-March, the $DOGE price has recovered from lows around $0.089 and is now pressing toward $0.10.
The bullish bias is now confirmed by recent candles showing a series of strong green bodies with higher highs and higher lows.
It is worth noting that Bollinger Bands' expansion often follows a breakout from a consolidation phase. In the current four-hour $DOGE chart, the price is hugging the upper band while the bands expand, confirming the bullish move.
Moreover, expanding bands during a trend usually mean momentum is building rather than fading. The trend is healthy since market participants are pushing prices decisively.
However, after expansion comes eventual contraction. Still, the expansion phase itself is where the big directional money is often made.
The recent price action shows repeated tests of support near $0.092, with resistance at $0.095 and $0.098. If volume picks up on the buy side, a break above $0.092 could accelerate toward $0.10.

 u.today