cryptonewsz.com

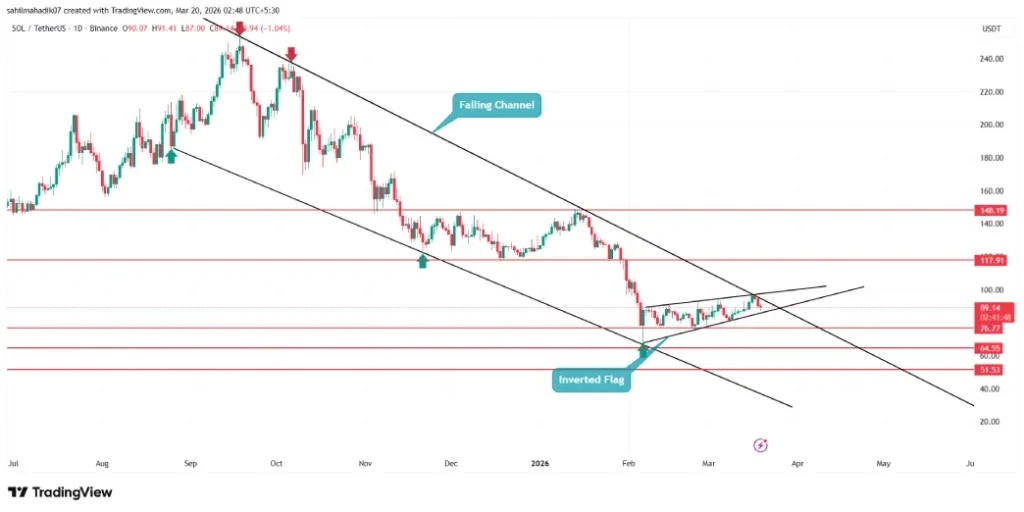
- The Solana price faces renewed selling pressure at the resistance trendline of a falling channel pattern in the daily charts.
- An inverted flag pattern on the 4-hour chart drives the ongoing recovery in $SOL.
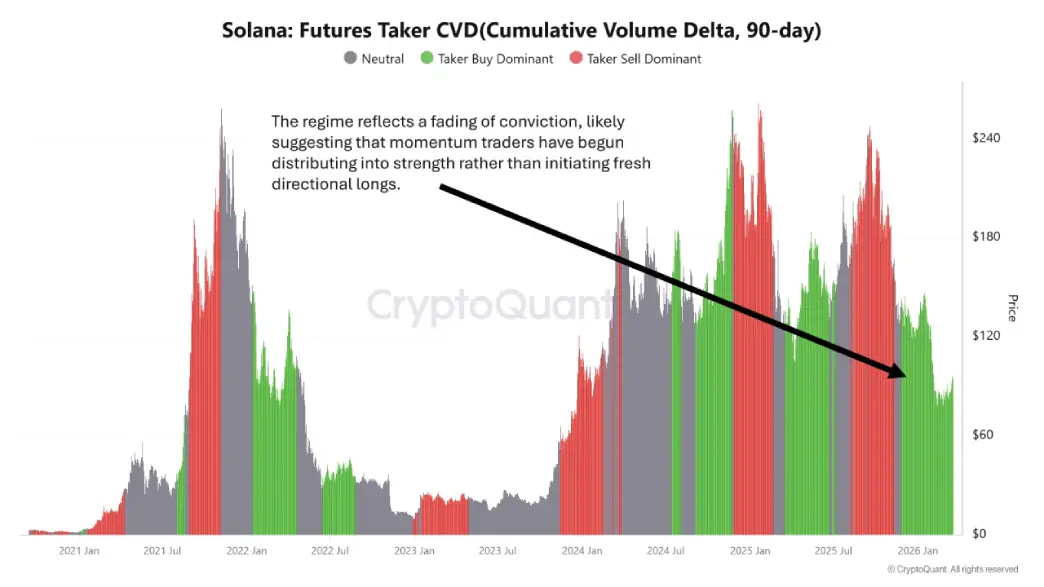
- Solana’s 90-day taker cumulative volume delta shows a clear transition from balanced aggression to dominant sell-side activity
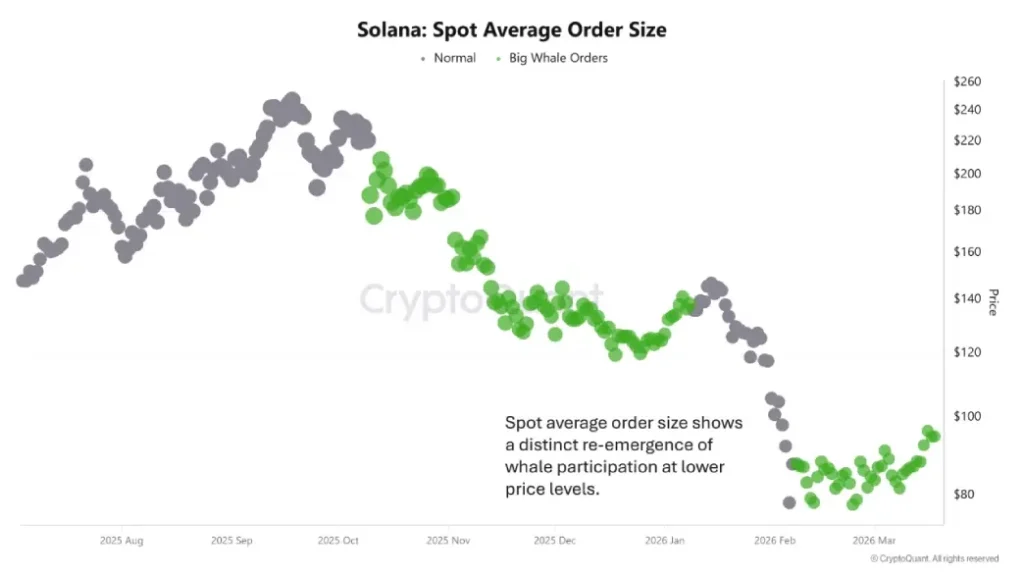
On Thursday, the Solana price plunged roughly 1.5% during U.S. market hours to its current trade at $88.7. This downtick came as a follow-up to yesterday’s sell-off, primarily due to a hawkish stance from the U.S. Federal Reserve and surging oil prices. Amid the broader market correction, the leverage traders are using occasional relief rallies for distribution while the big pocket investors— whales are building their position, suggesting a late-cycle behaviour. Will $SOL coin rebound for a $100 breakout?
$SOL’s Derivative Weakness Meets Spot Accumulation
Solana’s perpetual futures contracts show a change in trader behaviour in early 2026, with momentum participants offloading holdings on rallies rather than going on the offensive and opening new long positions. The 90-day taker cumulative volume delta has moved away from the alternating aggressive buying and selling seen through much of 2024 and into 2025, now showing the characteristics of late-stage exhaustion in leveraged markets.