
TL;DR
- Solana is currently testing the critical support level at $87.00.
- A breakdown below $87 could trigger a drop toward $75.
- Holding this support might spark a recovery toward $95 resistance.
Solana trades in technically delicate territory where immediate support at $92-94 will determine whether the network consolidates its recovery or reverts to the bearish trend of prior months. $SOL fluctuated between $83 and $97 during March 2026, reflecting market indecision regarding the durability of the bounce from $78 lows. As March progresses, the price has pulled back again from the resistance zone $95-100, reopening questions about the solidity of the upside move and the token’s ability to sustain gains.
The immediate support zone operates in the $92-94 range, acting as the first line of defense against further declines. Surrendering level exposes $SOL to descent toward a broader demand zone at $80-82.
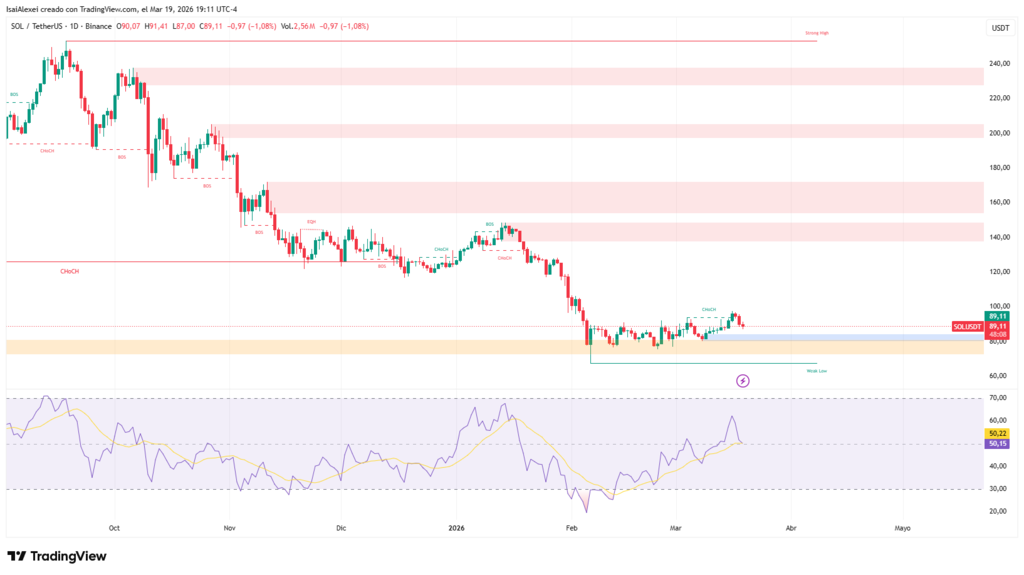
Below those levels, Solana faces potential drop toward the $70-75 range if bearish sentiment returns. Macroeconomic context remains unfavorable: $SOL completed approximately 50% decline over prior months, and although it rebounded 15% in March, technical indicators begin weakening again, suggesting selling pressure gains traction.
While $SOL maintains position above $90, the formation of ascending lows stays intact, preserving possibility of movement toward resistance $95-100 and potentially $105-110. However, if price falls below $82, that structure breaks and the market reverts to the bearish narrative dominating prior months.
Long-Term Downtrend Continues Exerting Weight Despite Transitory Bounces
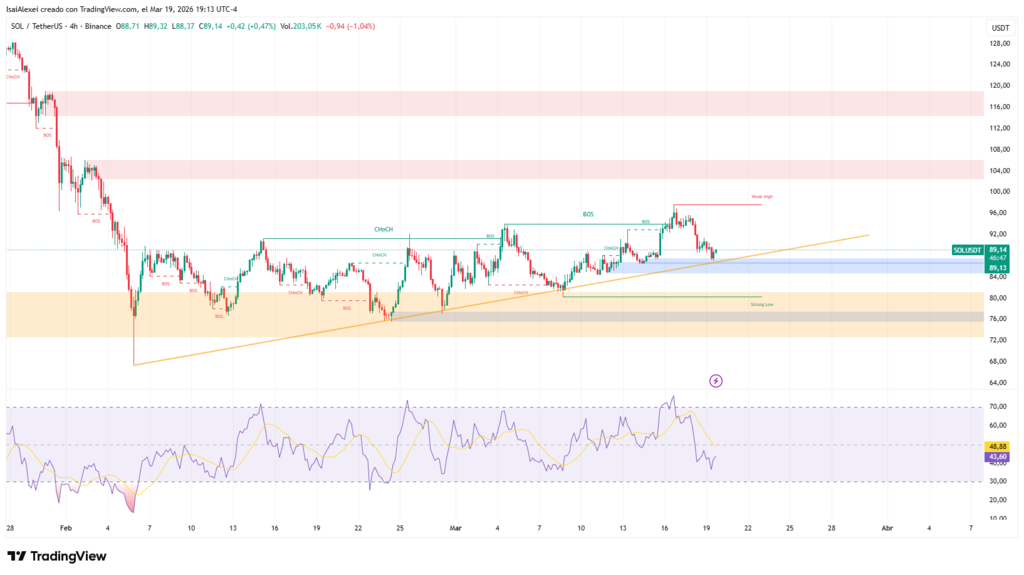
Long-term moving averages still signal overall downtrend, even as short-term moving averages show mixed signals. Misalignment between short-term price action and long-term structure creates risk of abrupt declines if support breaks. Traders who participated in the rally from $78 to $95 face decision: take profits or maintain bets on additional breakout toward $100+.
If support holds, the bullish scenario suggests consolidation with higher lows, followed by resistance test at $95-100. Successful breakout above $100 opens path toward $105-110. Alternatively, if support fails, $SOL drops toward $80-82, and potentially toward $70-75 under greater weakness. The market currently operates in a classic accumulation or distribution zone, where larger movement emerges only when price breaks one side or the other of the range.
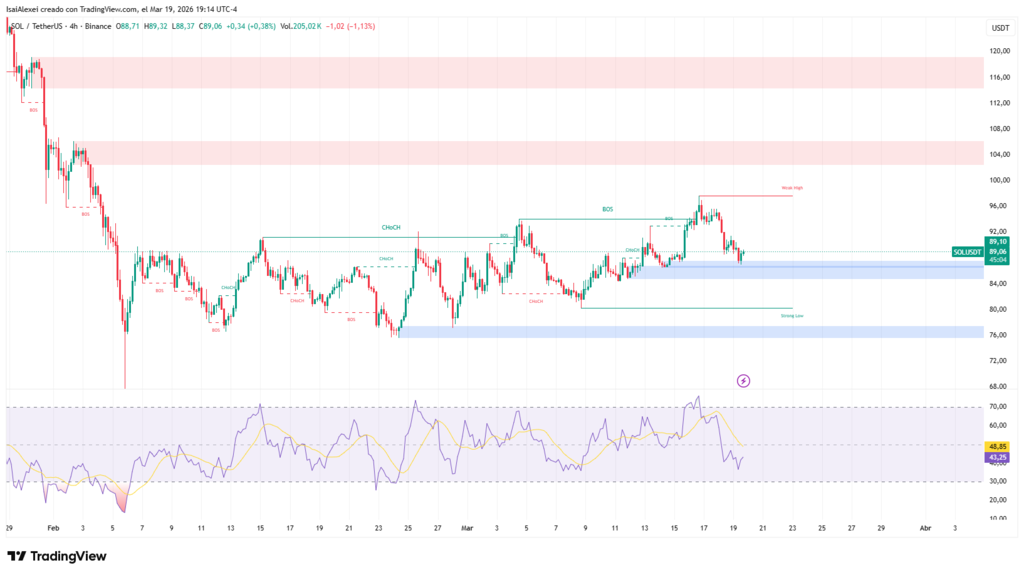
Key levels traders watch include $100 as major resistance, $82 as critical support, and $70 as potential capitulation zone. Momentum indicators show conflicting signals: short-term charts display potential for relief rally, while longer timeframes suggest downtrend remains in control.
Volume patterns remain thin, meaning sharp moves in either direction could occur with limited liquidity absorption. $SOL’s performance over coming days will determine whether March marks inflection point toward recovery or merely temporary interruption in broader downtrend.