There can be a few different types of Parallel Channels depending on how the trendlines are oriented with respect to the graph axes. Channels that are sloped upward are known as Ascending Channels, while those pointing down are called Descending Channels. In the context of the current topic, the third and simplest type is of interest: a Parallel Channel that’s parallel to the time-axis. This type corresponds to a period of true sideways movement in the cryptocurrency’s price.
Now, here is the chart shared by Martinez that shows the Parallel Channel potentially forming in the 4-hour price of Cardano over the past few weeks:
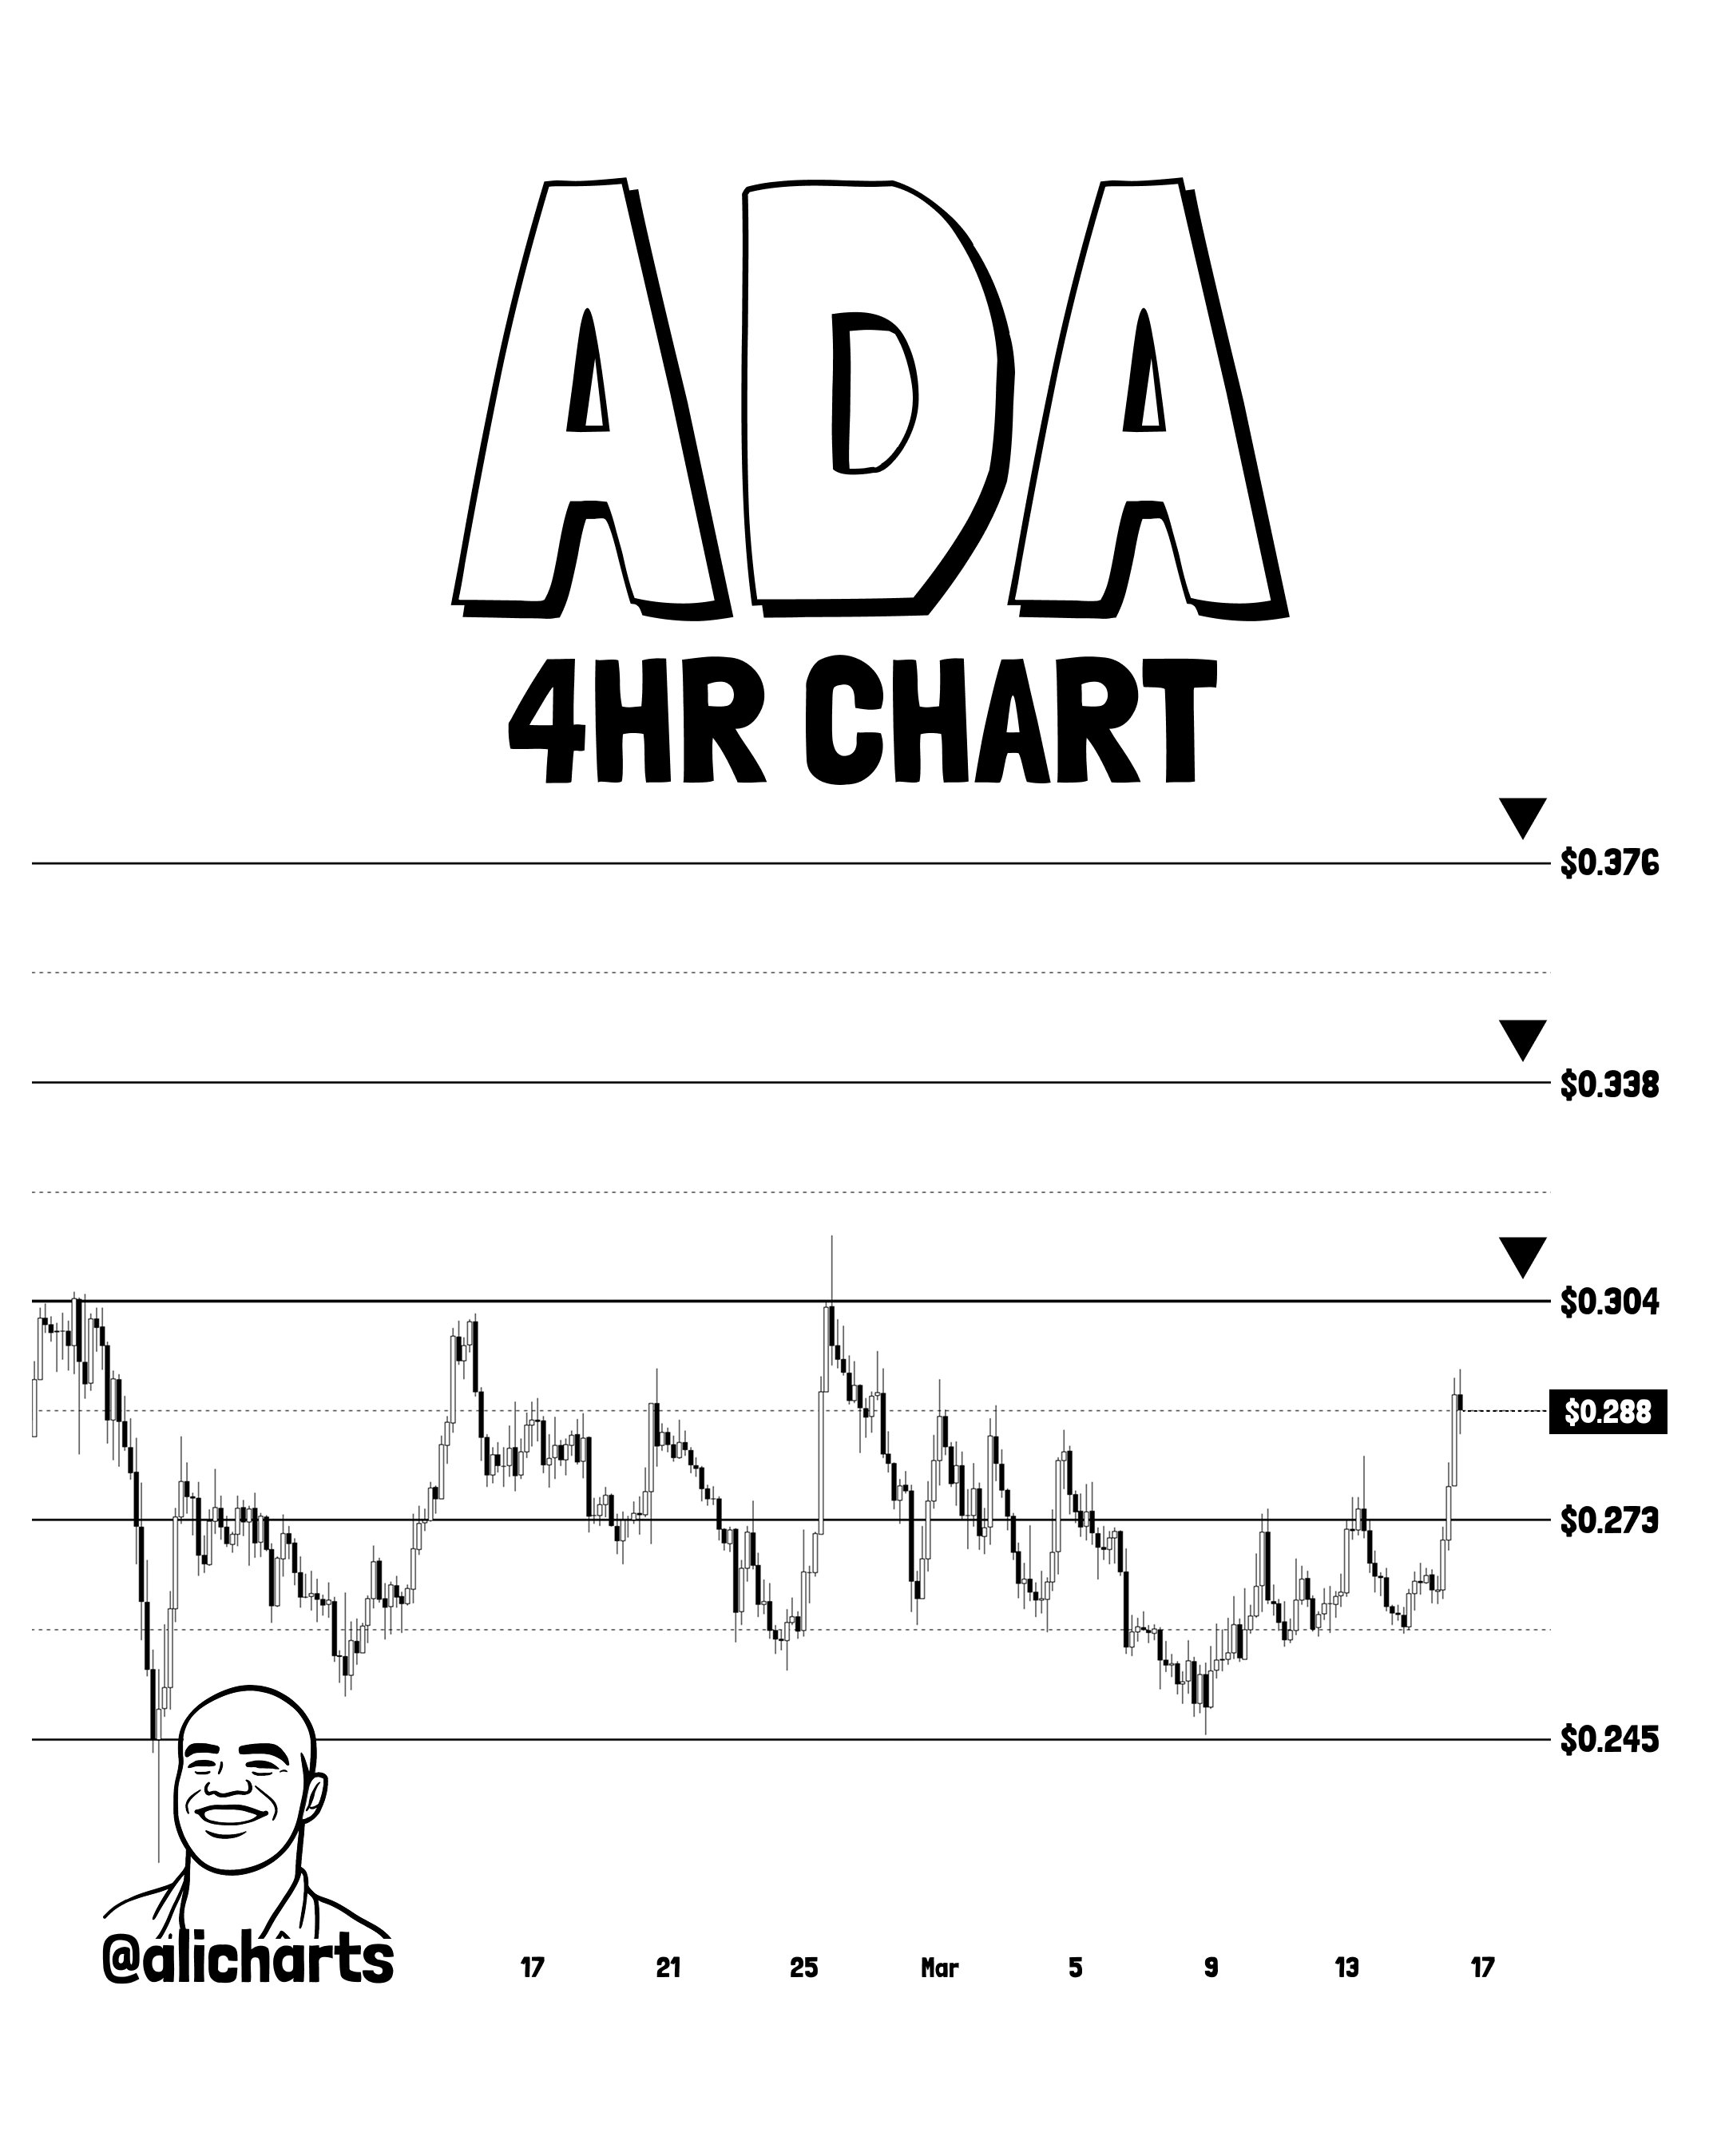
As displayed in the above graph, Cardano retested the lower level of this Parallel Channel earlier in the month and found support at it. The coin has since seen a rebound and has been making its way up the channel.
During the last couple of days, the digital asset sector as a whole has witnessed a bullish impulse and $ADA hasn’t been left out as its price has flown up to levels near $0.290. This surge has furthered the cryptocurrency’s journey inside the channel, taking it about 75% of the way to the upper level.
“45 days of sideways chop is nearing an end,” noted the analyst. “The key resistance is $0.304, which is the upper boundary of this channel.” As mentioned earlier, a break above a Parallel Channel can lead to a sustained bullish move. Based on this, Martinez has highlighted target levels for the asset.
From the chart, it’s visible that these levels lie at $0.338 and $0.376, corresponding to half-width and full-width distances above the channel, respectively. It now remains to be seen whether the latest rally will take Cardano to the $0.304 resistance and if a breakout will take place.
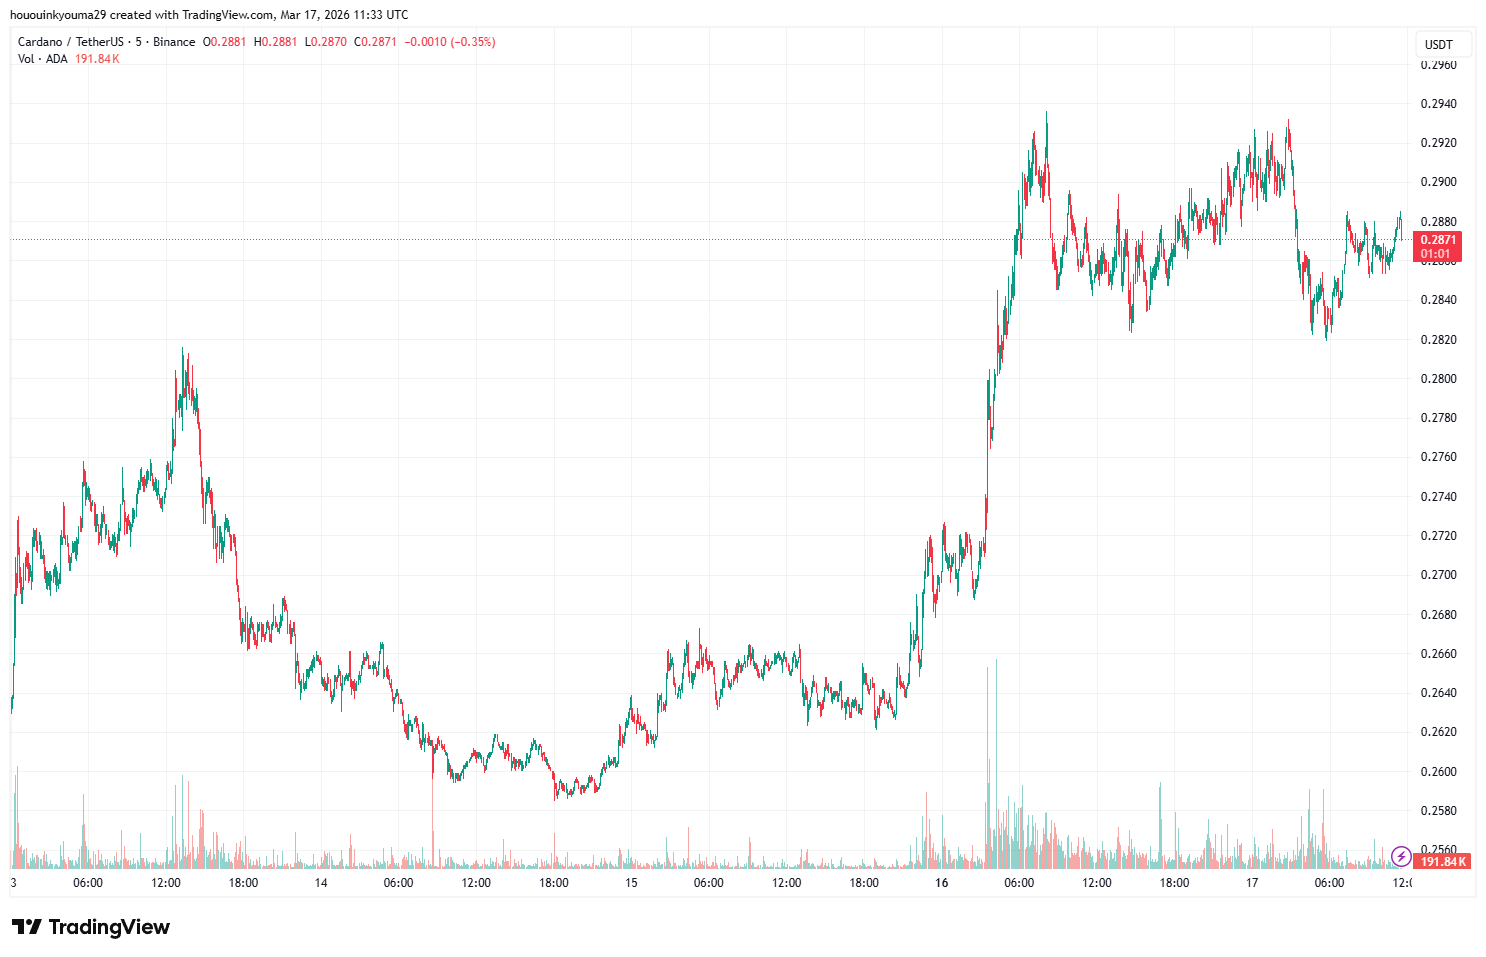
$ADA Price
At the time of writing, Cardano is floating around $0.288, up more than 8% over the last seven days.
Featured image from Dall-E, chart from TradingView.com

 newsbtc.com