
Following weeks of corrections, Bitcoin has once again tried to perform a bullish breakout after regaining the $75,000 level, indicating a possible change in momentum. The move represents the highest price level in a few weeks and comes after a rebound from February lows close to $60,000.
Bitcoin's key breakout zone passed
Technically speaking, the $75,000 area is a crucial breakout zone. The $72,000-$80,000 range has been identified by analysts as a significant resistance cluster that developed during earlier stages of consolidation.
A change from a recovery to a new bullish structure would be confirmed by clearing this area. Bitcoin may acquire the momentum required for a more powerful rally if buyers keep control above this point.
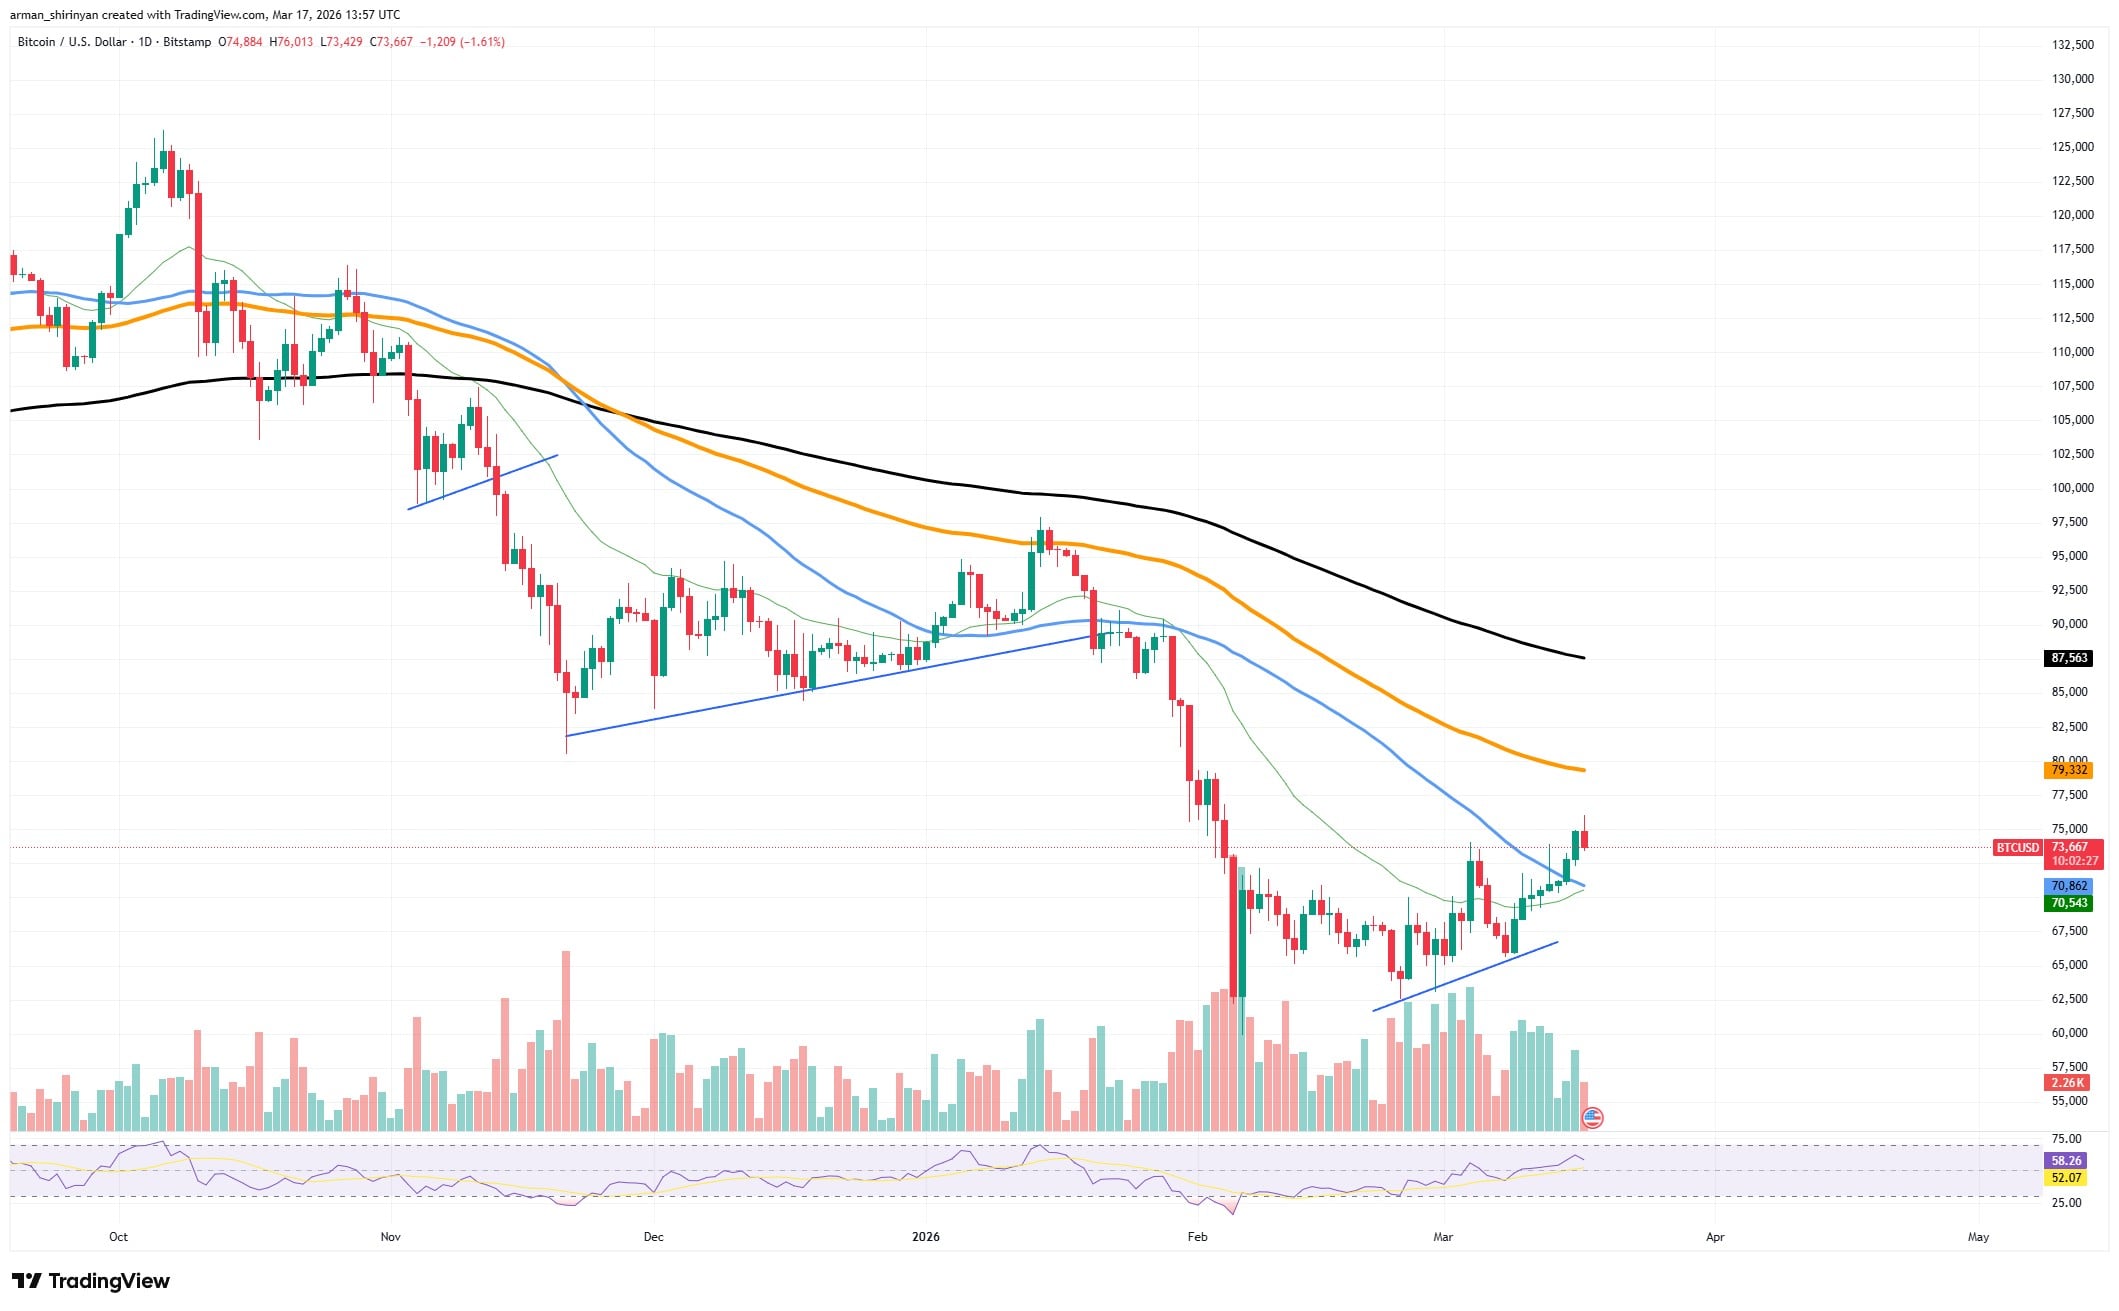
Improving sentiment and rising institutional flows contributed to the recent surge above $74,000. In recent weeks, billions of dollars have been invested in spot Bitcoin ETFs, and large investors are still building up supply. These elements imply that institutional demand is still one of the main forces behind the price increase of Bitcoin.
But there is no guarantee that it will reach $100,000. Strong resistance levels above the current price and macroeconomic uncertainty are two of the remaining challenges. The consolidation of Bitcoin between approximately $75,000 and $90,000 is still anticipated by many forecasts, followed by an attempt to reach new highs.
Shiba Inu's attempt was unsuccessful
Shiba Inu’s most recent attempt at recovery has encountered a significant technical obstacle, casting doubt on the token’s capacity to move into a long-term bull market.
$SHIB tried to stabilize and create a short-term reversal structure after weeks of decline, but the move eventually stopped at the 50-day exponential moving average (EMA), one of the chart’s most significant resistance indicators. The possibility of a short-term bullish breakout was essentially eliminated by rejection at this level.
The 50 EMA has served as a consistent dynamic resistance zone during the current downtrend. Sellers intervened and drove the price lower each time $SHIB got close to it, strengthening the larger bearish structure that has been controlling the market for months.
A small ascending structure created during the March recovery was followed in the most recent attempt. For a brief period, buyers were able to raise the price from local lows, resulting in a slight bounce that raised the possibility of a trend reversal. But as soon as $SHIB hit the 50 EMA, selling pressure increased.
The moving average was confirmed to be a strong ceiling rather than a starting point for a rally when the price rapidly lost momentum and was rejected. In technical terms, this rejection is a significant indication that the market is still firmly under bearish control.
What else is needed for $SHIB?
$SHIB would have needed to break above the 50 EMA and maintain that level as support in order for a real trend reversal to take place. Rather, the inability to recover it keeps the token trapped below important moving averages, such as the 100 and 200 EMAs, which are still sloping lower.
There are still issues with the overall structure. For months, $SHIB has been creating a series of lower highs and lower lows, which clearly points to a long-term decline. Any short-term bounce is more likely to be seen as a relief rally than the start of a true bull market until that pattern shifts.
This rejection warns investors to exercise caution. The likelihood of additional declines is still high unless $SHIB is able to recover and stabilize above the 50 EMA. The recent bounce might not be the beginning of a long-term recovery but rather just another brief pause in an ongoing bearish cycle in the absence of a clear technical shift.
Ethereum is moving back
After weeks of continuous downward pressure, Ethereum is beginning to show signs of recovery, but the larger market structure is still risky.
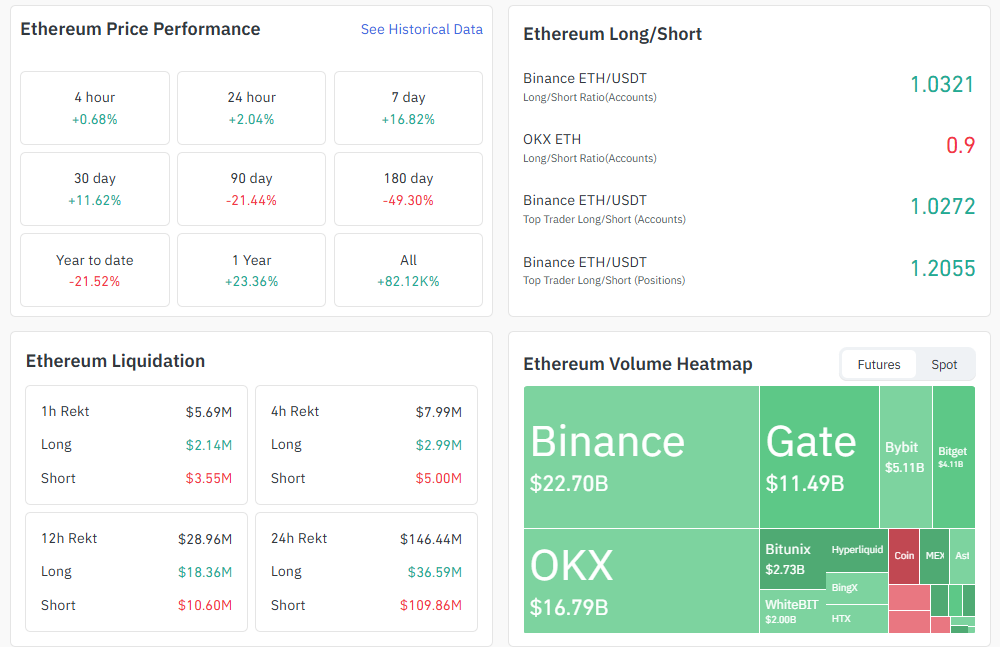
$ETH has recently experienced a brief rebound, rising back toward the $2,300-$2,400 range after a severe decline earlier this year that drove the asset below several significant support levels.
Ethereum is currently making an effort to pick up steam after rising from lows close to $2,000. Rising volume and strengthening RSI momentum supported the recent upward trend, which created a short-term bullish structure.
Ethereum has to break through
Ethereum is still trading below its key trend indicators despite the rebound, indicating that the overall trend has not yet returned to bullish territory. At the moment, the 100-day and 200-day exponential moving averages represent the most significant technical obstacles.
These levels, which are situated close to $2,500 and $2,800, respectively, create a distinct resistance corridor that $ETH needs to cross in order to validate a longer-lasting trend reversal.
The first significant test of the current recovery is the $2,500 area, which is in line with the 100 EMA. Ethereum would indicate that buyers are taking back control of the medium-term trend if it were to break and stay above that level.
Even a successful breakout there, though, would probably go straight into the 200 EMA, which is located at $2,800, the next significant resistance level. For long-term bullish and bearish market structures, the 200 EMA frequently serves as the boundary.
As of right now, Ethereum’s recovery is still technically feasible but not yet complete. After a significant correction, the market is stabilizing, but only if $ETH is able to recover $2,500 and then challenge the $2,800 mark will there be a true indication of strength.