The Symmetrical Triangle
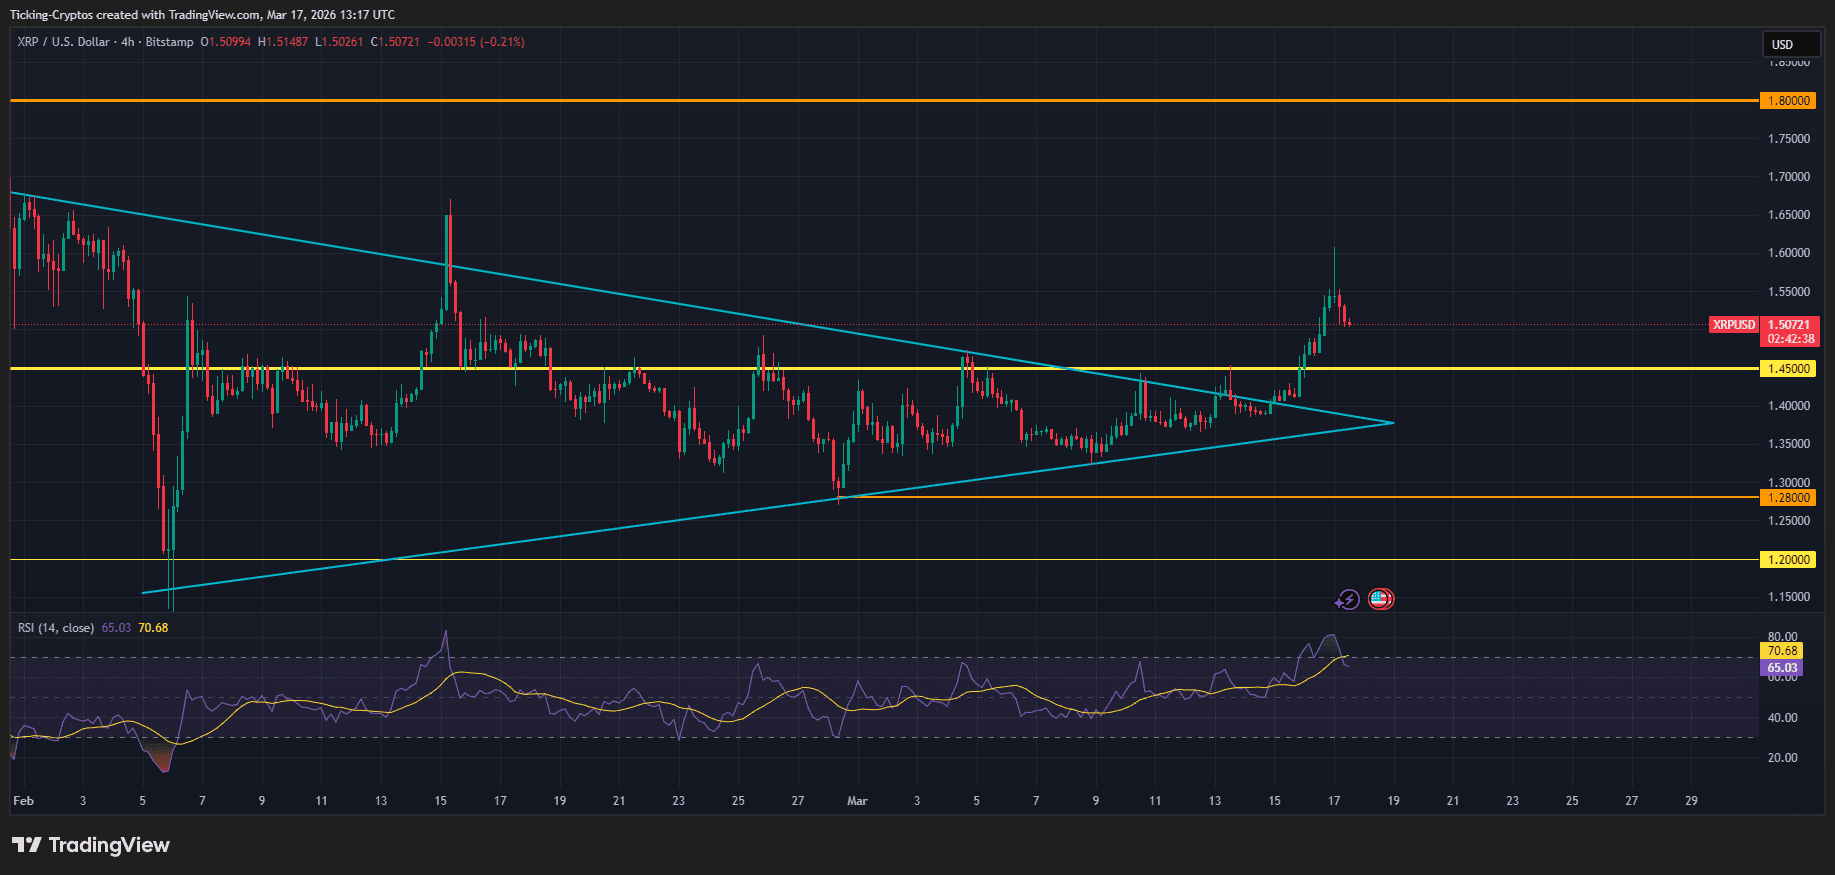
A symmetrical triangle is a chart pattern characterized by two converging trendlines connecting a series of sequential peaks and troughs. In $XRP’s case, this pattern represented a period of "equilibrium" where buyers and sellers were in a deadlock. Typically, a breakout from this formation indicates that the prevailing trend—in this case, the bullish momentum from late 2025—is ready to resume with high volume.
The Breakout: How $XRP Breached the Triangle
The most critical development in the recent $XRP-USD price action is the upward breach from the triangle formation. Since February 2026, $XRP has been making lower highs and higher lows, narrowing into an apex near the $1.38 mark.
On March 14, trading volume surged by over 300%, providing the necessary fuel for $XRP to pierce the upper descending trendline. This "breach" was not merely a wick but was followed by a daily candle close above the resistance, effectively flipping it into a support floor. Technical analysts often view this specific type of exit from a triangle as a signal that the "accumulation phase" is over and the "markup phase" has begun.
Technical Indicators Supporting the $2 Target
Beyond the triangle breakout, several other indicators point toward a continued rally:
-
Moving Averages: $XRP is now trading comfortably above its 50-day and 200-day Exponential Moving Averages (EMAs).
-
Relative Strength Index (RSI): The RSI is currently at 64, suggesting that while the asset is gaining strength, it is not yet "overbought" (which typically occurs above 70).
-
Institutional Inflows: According to data from CoinShares, $XRP-specific investment products have seen over $1.3 billion in cumulative inflows this year, providing the structural liquidity needed to sustain a move to $2.00.
Key Support and Resistance

 cryptoticker.io