coinpaper.com

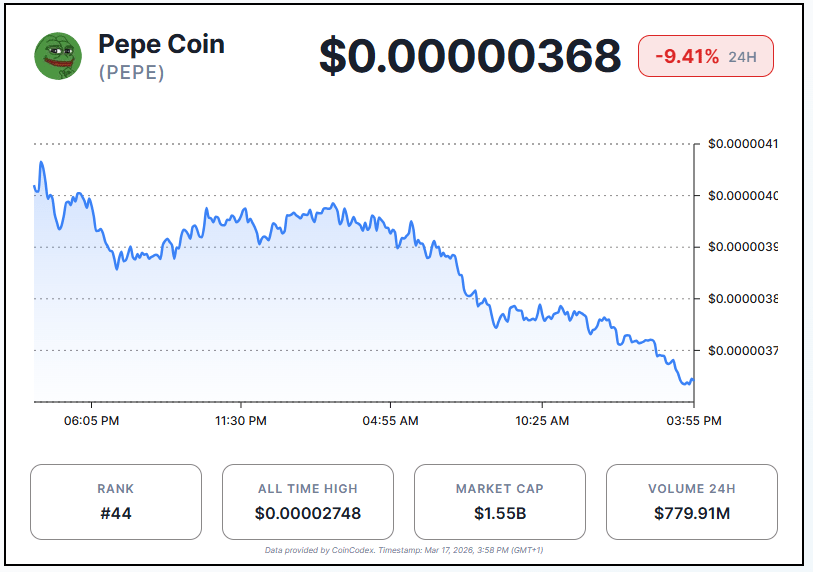
$PEPE is trading at around $0.00000368 at the time of writing, down roughly 9.41% over the last 24 hours. The price struggled to hold above $0.00000395 before sellers pushed it lower. Bearish pressure increased as support weakened, leading to a steady downward move. Lower highs continue forming, confirming short-term weakness in momentum. If $0.00000370 fails, the price may drop toward $0.00000350.
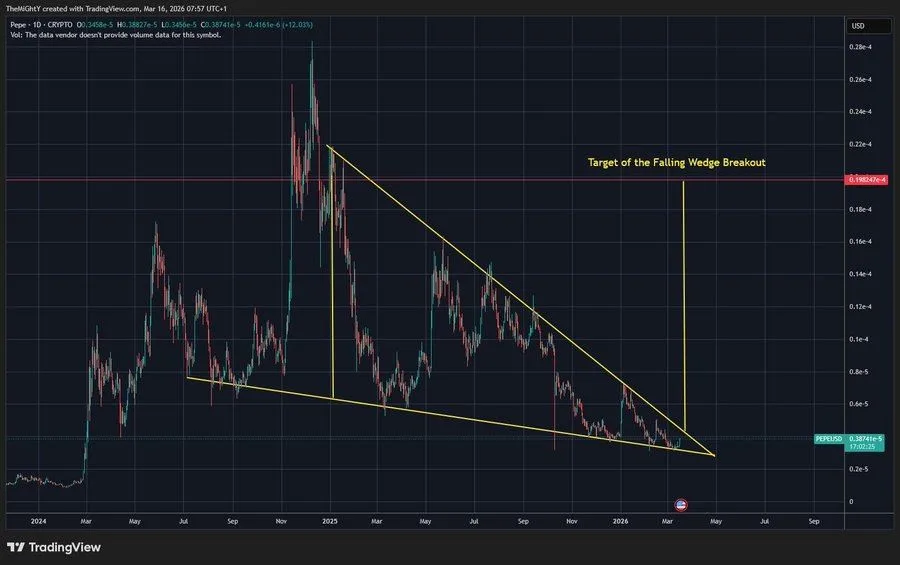
$PEPE Eyes Bullish Breakout as Falling Wedge Signals Potential Rally
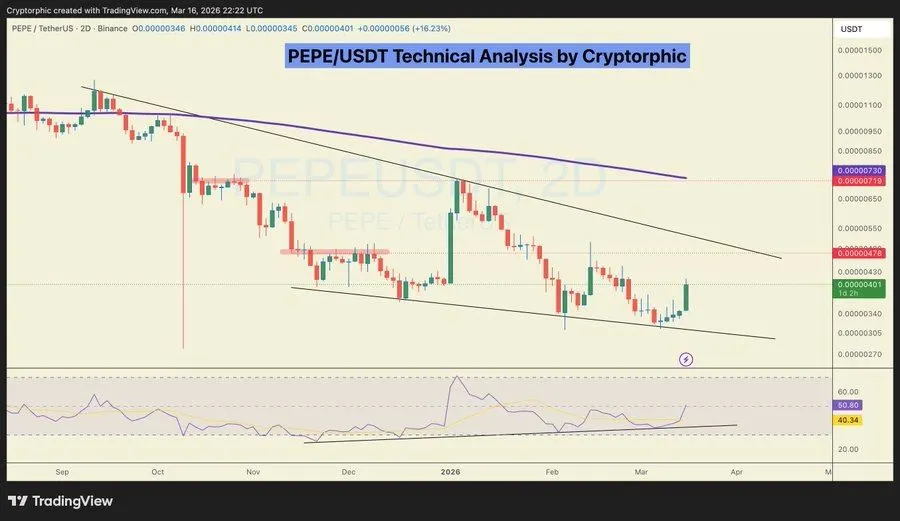
The $PEPE/USDT 2-day chart, analyzed by Cryptorphic, shows price forming a Falling Wedge pattern, a classic bullish reversal setup. Current price sits at $0.00000401, approaching the upper wedge resistance, signaling potential upside if broken. The lower trendline has acted as strong support multiple times, indicating buyers are stepping in near lows. Recent candles suggest growing bullish momentum, hinting at a possible short-term trend reversal.