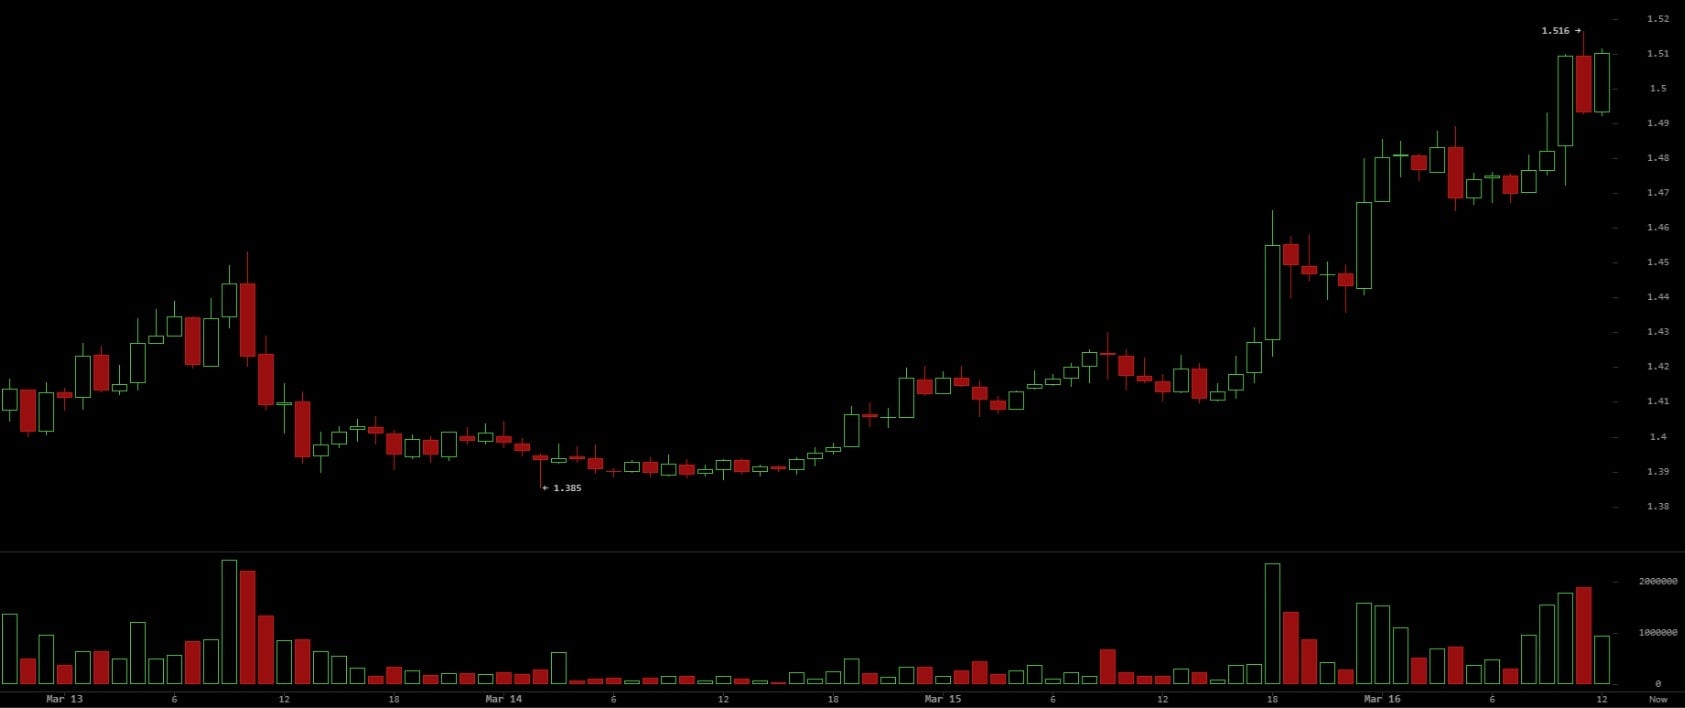
$XRP 1-hour price chart on March 16 via Bitstamp.
Institutional Demand, Macro Signals Reinforce $XRP Rally
Institutional flows and macro positioning are also reinforcing the constructive backdrop surrounding $XRP’s rally. U.S.-listed spot $XRP ETFs have surpassed $1.3 billion in cumulative inflows within their first 50 days of trading, underscoring sustained institutional demand for the asset. At the same time, traders are positioning ahead of the Federal Reserve’s March 16–17 meeting, where markets broadly expect policymakers to keep interest rates steady, a scenario that typically supports liquidity-sensitive assets such as cryptocurrencies.
A modest pullback in the U.S. Dollar Index toward the 99.8 area has further eased pressure on dollar-denominated assets, while elevated oil prices above $105 per barrel and geopolitical tensions have added volatility to traditional markets and encouraged selective rotation into digital assets. Sentiment has also been supported by momentum in Washington around the CLARITY Act, which aims to establish a clearer regulatory framework for digital assets in the United States, alongside Ripple’s conditional approval for a U.S. National Trust Bank Charter that would allow the company to operate more directly within the American financial system for its institutional payment infrastructure.
Technical indicators continue to reflect strong bullish momentum while approaching stretched levels. The Relative Strength Index ( RSI) is near 69.9, hovering just below overbought territory and signaling strong upward momentum following the recent breakout. The Moving Average Convergence Divergence ( MACD) remains positive, with the MACD line around 0.01906 and the signal line near 0.01691, while the histogram stays above zero and reflects sustained bullish pressure. From a moving average (MA) standpoint, $XRP is trading decisively above both the 50-period MA near 1.470 and the 200-period MA around 1.433, reinforcing the strength of the trend. Bollinger Bands are widening as volatility expands, with price pressing along the upper band near 1.512 while the lower band remains significantly lower near 1.429.
If $XRP continues to hold above the $1.50 region while macro conditions remain supportive ahead of the Federal Reserve decision, the current trend could extend as buyers test higher resistance levels. However, with RSI approaching overbought conditions and price stretched toward the upper Bollinger Band, short-term pullbacks toward the $1.47 region near the 50-period moving average would be a natural consolidation if momentum temporarily cools.
FAQ 🧭
-
Why is $XRP rising above the $1.50 level?
Strong technical momentum, institutional ETF inflows, and supportive macro expectations are driving the latest price breakout.
-
What key technical levels are investors watching for $XRP?
Traders are monitoring resistance near $1.51 while support sits around the $1.47 and $1.43 moving averages.
-
How significant are $XRP ETF inflows for long-term demand?
More than $1.3 billion in early inflows signals growing institutional exposure and sustained market interest.
-
Could the Federal Reserve decision impact $XRP price momentum?
A steady rate outlook may support liquidity conditions that often benefit risk assets like cryptocurrencies.

 news.bitcoin.com