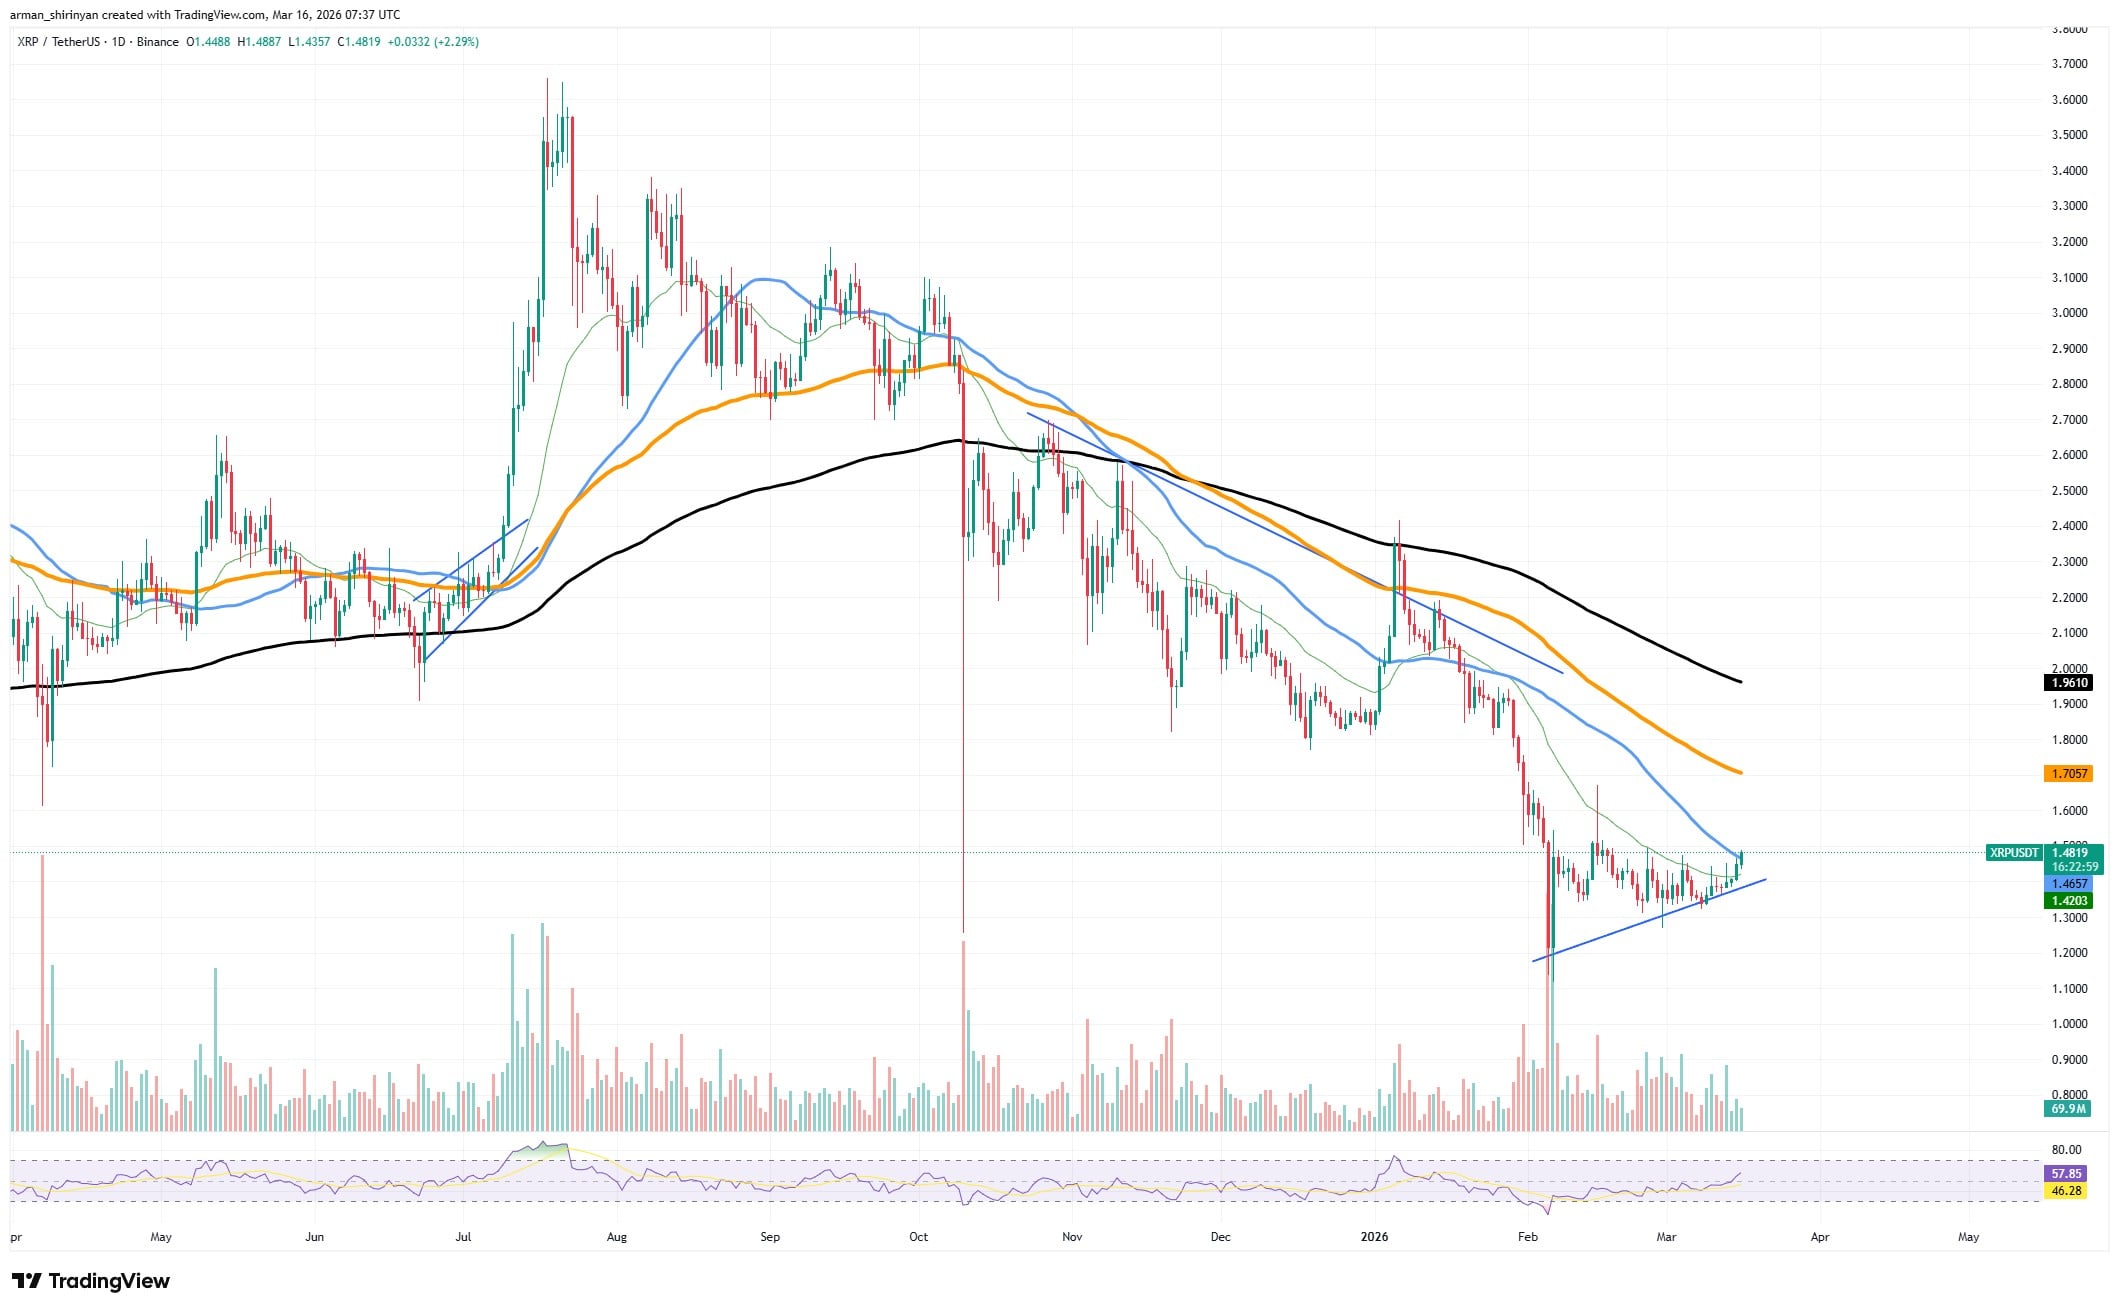
The asset is currently getting closer to the 50-day exponential moving average (EMA), which remains a significant resistance level and is located just above the current price. The 50 EMA has consistently rejected upward attempts during the recent decline, highlighting its significance as a technical barrier.
Is this first reversal?
The market may witness the first real reversal signal in months if $XRP is able to get to this point and move through it with strong momentum. But simply breaking the moving average is insufficient.
The market requires more than just a quick surge past resistance; it needs a steady hold above it. $XRP has demonstrated a propensity for fake breakouts in the past, in which the price momentarily rises above resistance before swiftly declining back below it. When the price reverses, these unsuccessful breakouts frequently trap traders who enter too early, increasing selling pressure.
For this reason, it is necessary to confirm the current configuration. Buyers must keep $XRP above the declining resistance line and progressively reclaim adjacent moving averages in order for the asset to establish a true recovery trend.
The structure developing on the shorter time frame is another positive aspect. The rising support trendline that $XRP has been constructing suggests that buyers are gradually entering the market at higher price points. This pattern of slow accumulation frequently comes before more forceful directional movements.
$XRP may start aiming for the next resistance zone, which is between $1.70 and $1.90, where stronger selling pressure has previously surfaced, if the asset manages to clear the 50 EMA and stabilizes above it.

 u.today