As of this writing, Cardano ($ADA) trades at $0.264, reflecting a period of consolidation that has persisted since the beginning of the year.
While price action remains subdued, recent network developments and chart patterns warrant attention from market participants.
Recent Network Developments
Two notable updates have emerged in the Cardano ecosystem recently. First, Cardano has been integrated into the Brave browser’s native wallet infrastructure, enabling cross-chain swaps and exposing $ADA to a broader user base. Second, the upcoming Ouroboros Leios upgrade promises to enhance network throughput, addressing historical concerns regarding transaction speed.
Additionally, a recent data visualization initiative has revealed that Emurgo—one of the three founding entities—now exercises approximately 17% of voting influence through Yoroi wallet default delegations. This concentration raises questions about governance decentralization that the community may need to address.
Technical Analysis: $ADA/USD
On the USD pair, Cardano trades at $0.264, maintaining a position within a defined range established over recent months.
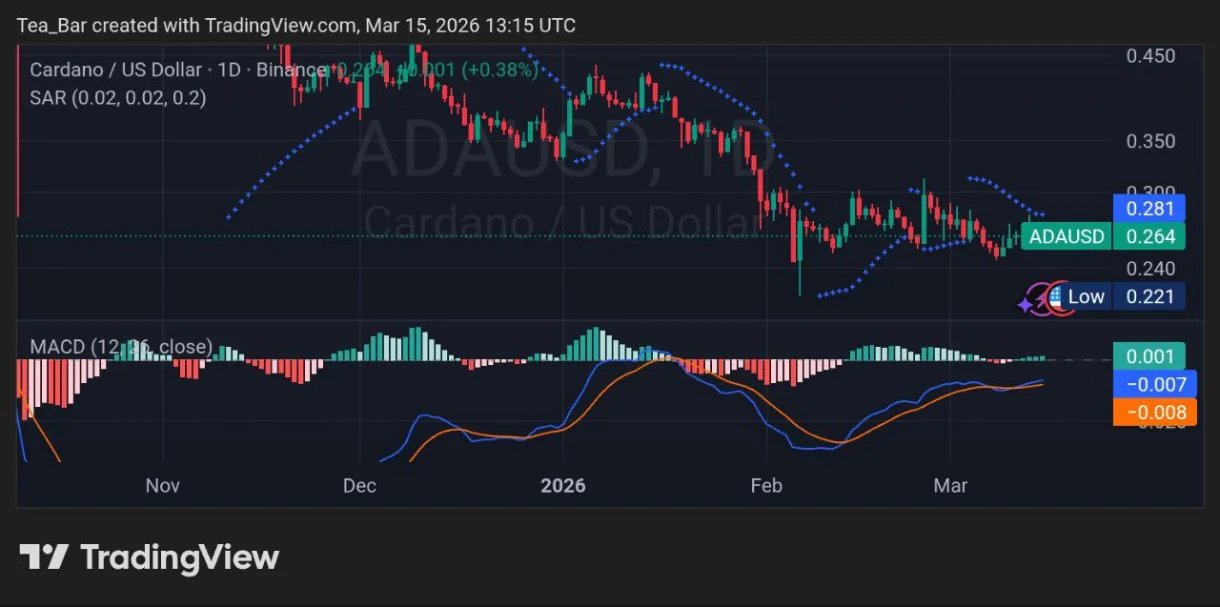
Key Levels:
The frequency with which price has revisited the $0.264 level suggests it has become a psychologically significant threshold. A sustained breach below $0.221 would likely signal further downside, while a break above $0.450 would indicate a potential trend reversal.
Volume patterns during recent tests of these levels show decreasing sell pressure near support, suggesting that accumulation may be underway.
Technical Analysis: $ADA/$BTC
Against Bitcoin, Cardano trades at 0.00000370 $BTC on the daily chart. This pair is particularly instructive as it filters out broader market noise and reveals $ADA’s relative strength.
The Parabolic SAR indicator has positioned dots below the candles, suggesting short-term bullish momentum relative to Bitcoin. This configuration typically indicates that the uptrend is intact and that recent pullbacks have been buying opportunities rather than reversal signals.
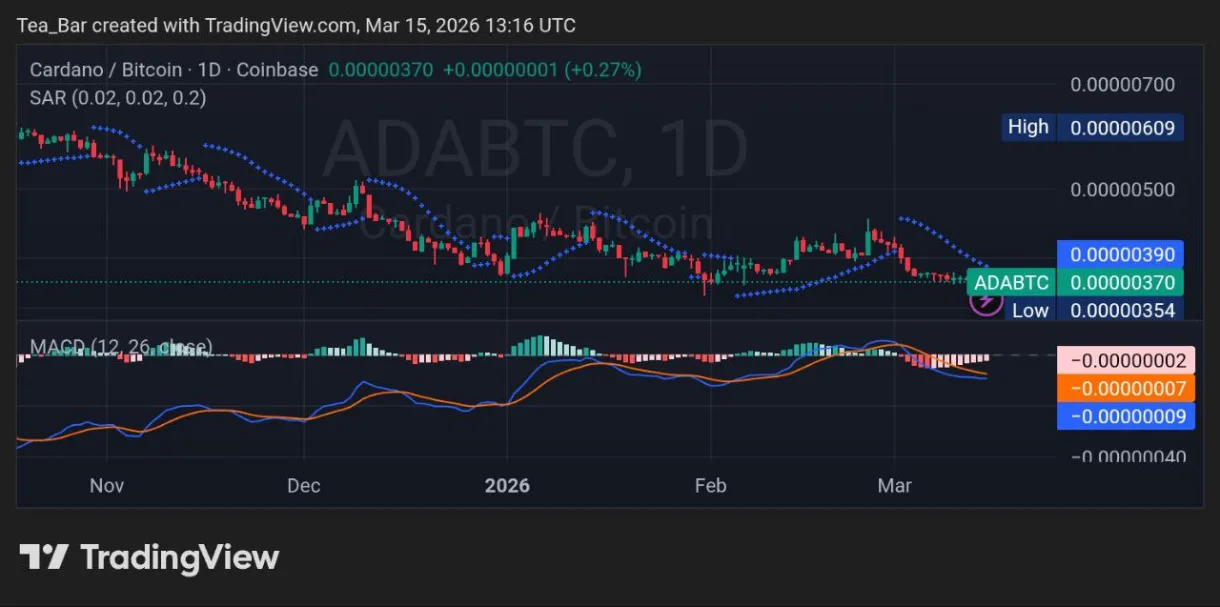
The Moving Average Convergence Divergence (MACD) indicator shows a bullish crossover, with the MACD line positioned above the signal line. The histogram has turned positive, confirming improving momentum. This is the first such crossover since late 2025, making the signal particularly noteworthy.
A Market Waiting for Cardano’s Next Move
At the current price of $0.264, Cardano presents an increasingly interesting technical setup. Short-term indicators against Bitcoin are flashing bullish signals for the first time in months, while the USD pair continues to hold steady at a level that has historically attracted buyers.
The Brave integration introduces potential new users, the Leios upgrade aims to improve performance, and governance discussions continue to shape the network’s long-term evolution.
For traders, a break above $0.450 would confirm a broader trend reversal. For longer-term investors, accumulation near major support zones has historically proven strategic.
Yet in a market where attention shifts quickly and capital flows toward momentum, the real question remains: will the market recognize Cardano’s progress before the next major move begins?
More Must-Reads: