
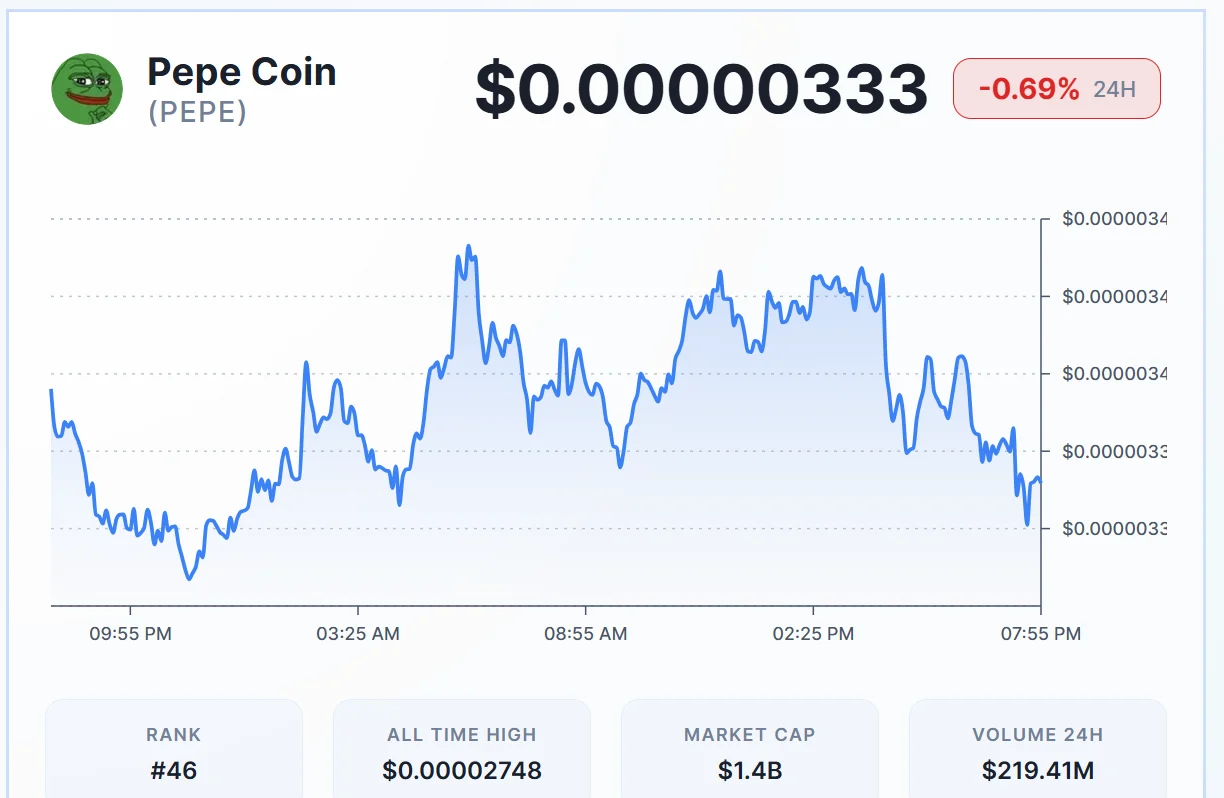
Pepe is trading around $0.00000333, down approximately 0.69%, reflecting mild bearish pressure in the short term. The token shows repeated rejection near the $0.00000336–$0.00000338 resistance zone, where sellers consistently step in. Price continues hovering near the $0.00000332–$0.00000334 support area as volatility remains moderate. Sustained movement below this support could increase downside risk, while reclaiming $0.00000336 may restore short-term bullish momentum.
$PEPE Price Eyes 200% Rally if $0.0000050 Breaks
According to analyst Pepe Whale, $PEPE is consolidating near $0.0000042 after a prolonged decline and tight price compression. The chart shows declining volatility as the token trades within a narrow range. Key resistance sits between $0.0000048 and $0.0000050, which has rejected several breakout attempts.
A daily close above $0.0000050 would invalidate the current bearish structure. Such a move could quickly push the price toward $0.0000085 as momentum returns. If bullish momentum accelerates, a run toward $0.0000120 becomes possible before April.
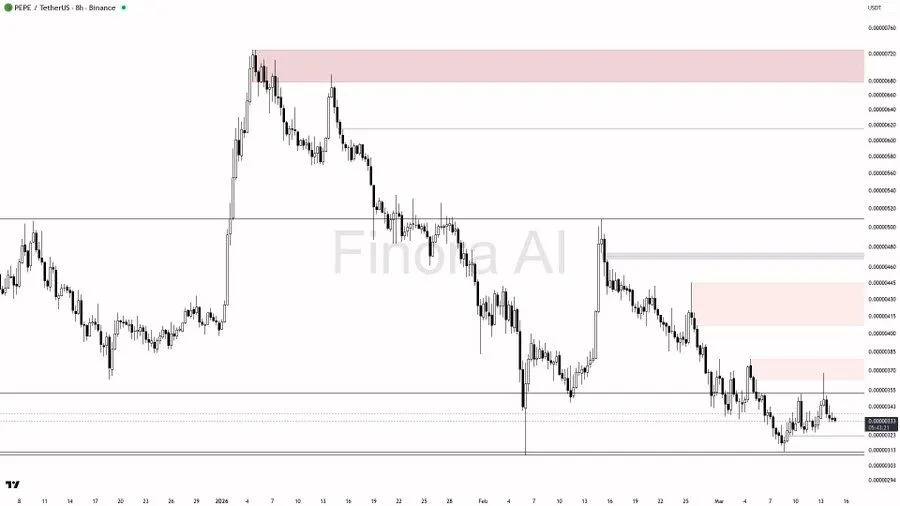
Pepe Whale also warns that downside risk remains significant if support fails. The critical support level currently sits near $0.0000038, acting as the market’s defensive line. Losing that level on a daily close could trigger aggressive selling pressure. The next meaningful support only appears near $0.0000026, creating a potential 30% downside move. Thin liquidity below $0.0000035 could accelerate any decline. For now, $PEPE remains trapped between breakout potential and a sharp liquidity-driven correction.
$PEPE Price Holds Key Support Near $0.00000327 as Bearish Momentum Weakens
$PEPE is trading around $0.00000334 on the daily chart, continuing a broader downward trend. Price action shows lower highs and weak recovery attempts. Immediate support appears near $0.00000327, where buyers previously stepped in. A breakdown below this level could trigger further downside pressure. Short-term resistance sits around $0.00000355–$0.00000390, where past rebounds struggled to continue.
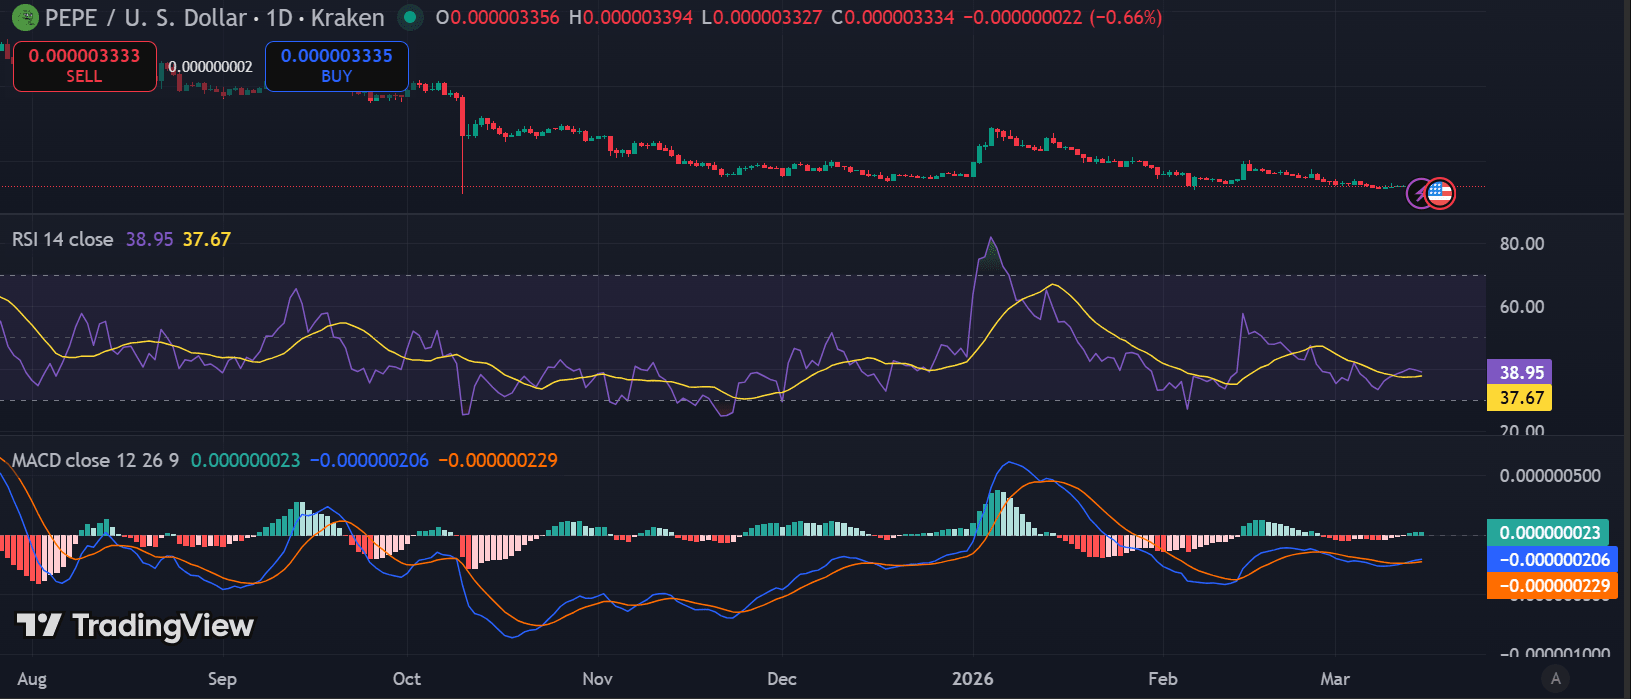
The RSI (14) sits near 38, remaining below the neutral 50 level and reflecting weak momentum. RSI also tracks slightly under its signal average near 37.6. This positioning suggests sellers still dominate short-term momentum. Meanwhile, the MACD histogram remains slightly negative but is flattening. The MACD and signal lines are converging, hinting that bearish momentum is gradually weakening.