
If you have been watching the crypto markets recently, you might have noticed a strange discrepancy. On one hand, Chainlink ($LINK) has been trading sideways, consolidating around the $9.27 mark. On the other, you can’t seem to stop hearing about it.
According to recent data from the social intelligence platform LunarCrush, Chainlink has experienced a massive spike in social engagement—up nearly 500% in a short period.

When price action is flat but conversation explodes, volatility usually follows. The question is: which direction?
The Institutional Narrative
The buzz isn’t random. It is tied to Chainlink’s evolution into the backbone of institutional finance. Major players like Fidelity are using Chainlink to bring Net Asset Value (NAV) data on-chain, and the SWIFT banking network has successfully integrated with Chainlink’s Cross-Chain Interoperability Protocol (CCIP).
These are not speculative partnerships; they are infrastructure deals that position $LINK as the universal translator between traditional finance and blockchain networks.
What the Charts Say
The technicals align with this accumulation narrative. Let’s look at two key charts as of March 15, 2026.
$LINK/USD (Coinbase – Daily)
On the USD pair, Chainlink is trading at $9.27, holding above key support. The Parabolic SAR recently flipped bullish, suggesting the short-term correction may be over.
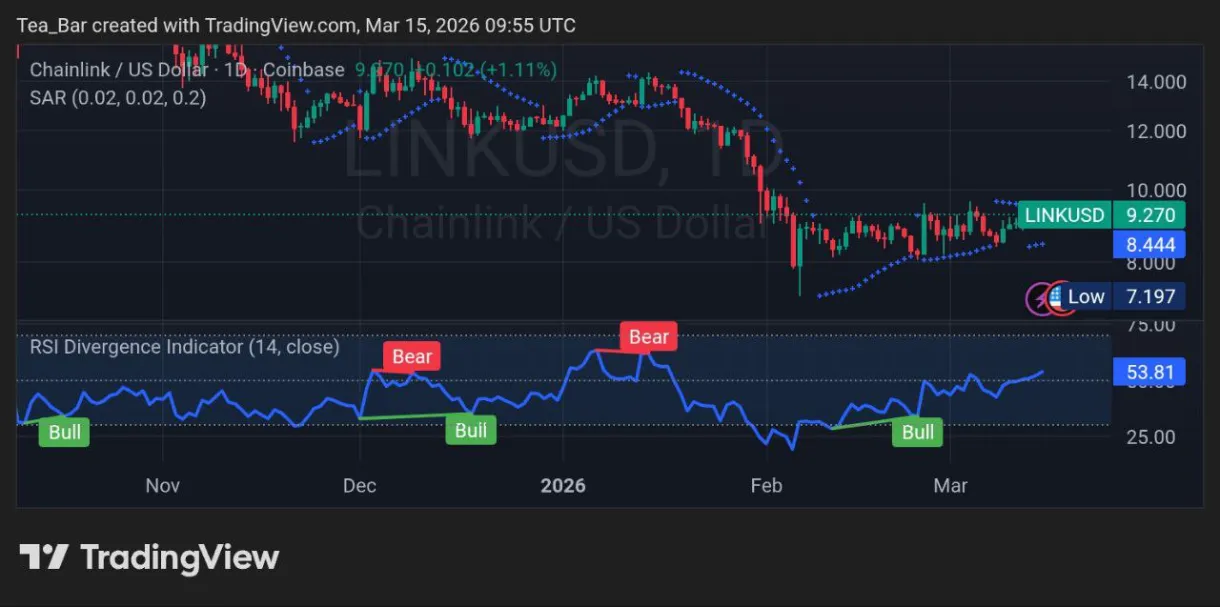
More importantly, the RSI shows a clear bullish divergence: while price made a lower low near $7.20 in February, the RSI made a higher low. This indicates that selling momentum was exhausted even as the price dropped—a classic reversal signal.
$LINK/$BTC (Binance – Daily)
Against Bitcoin, Chainlink trades at 0.0001291 $BTC. This pair has been in a long-term downtrend, but it recently broke above a descending trendline that had rejected rallies for months. After breaking out, it successfully retested that level as support near 0.0001185.
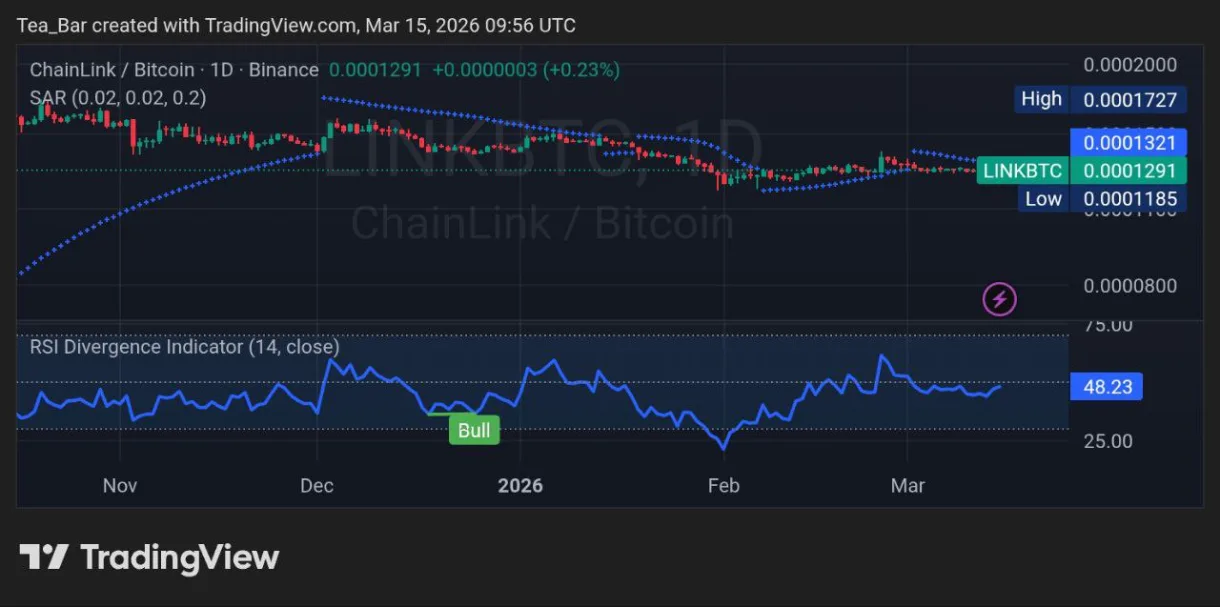
This “break, retest, and hold” pattern is technically bullish. The RSI also confirms a neutral to bullish divergence here, signaling that bearish momentum against Bitcoin is fading.
The Takeaway
When price diverges from attention, the market is usually wrong about one of them. In this case, the fundamentals and technicals both suggest accumulation, not distribution.
For current holders, this is a signal of conviction. For those on the sidelines, it suggests you might be looking at a launchpad rather than a lull. The social volume spike tells us the crowd is waking up; the charts tell us the setup is ready.
Keep your eyes on the charts, but keep your ears on the conversation. The two are about to meet.
More Must-Reads: