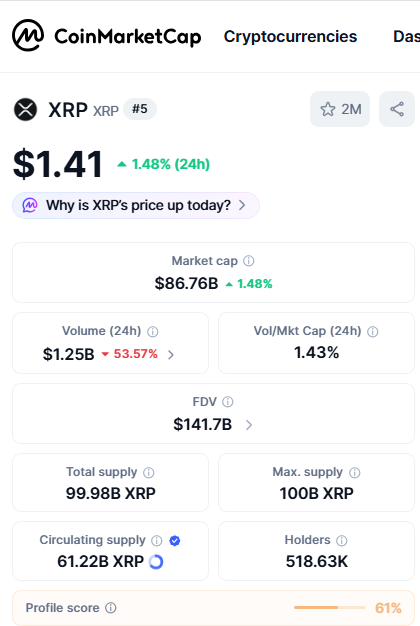
The rise continues a recovery from the March 8 low of $1.32. Although $XRP price rise has been slow, the market is presenting signs of renewed demand.
Analysts suggest that indicators that have historically marked the end of past downturns suggest the market sell-off could be entering its final phase.
Even if selling fades, a sustained recovery needs fresh demand, and there might be early signs it is arriving.
What to watch?
Going forward, early signs of stabilization will be watched in ETF flows, which could be one source of renewed demand.
$XRP ETFs marked their second consecutive week of negative inflows (outflows) after four straight weeks of inflows in February. If ETF inflows return, it could boost $XRP demand.
However, bear markets can continue even when technical signals and market fundamentals suggest otherwise.
$XRP price hints at incoming move
Since March 10, $XRP has traded sideways in a tighter range, with the price trading between $1.36 and $1.45.
Volatility indicators are squeezing. Bollinger Bands on the daily chart have tightened; this pattern often precedes a larger directional move once liquidity returns.
Meanwhile, daily transactions are on the rise. According to Evernorth, $XRP transactions have nearly tripled, nearing 3 million per day as of this week, up from nearly 1 million per day in mid-2025.

 u.today