However, the $AVAX price bounced from $8.81 to $10in the last four days’ registering a gain of 10.1%. Consequently the asset’s market cap surged to $4.27 billion. $AVAX gained this additional momentum as the asset management company Grayscale launched its $AVAX Staking ETF (ticker: GAVA) on Nasdaq. The product, which began trading on March 12, 2026, provides regulated exposure to $AVAX while incorporating staking rewards.
However, the total value locked (TVL) on $AVAX has not changed much near $800 million since early February, according to data from DefiLlama. The lack of growth in locked capital implies that little new liquidity has been entering the Avalanche ecosystem in recent weeks, as far as its DeFi protocols are concerned.
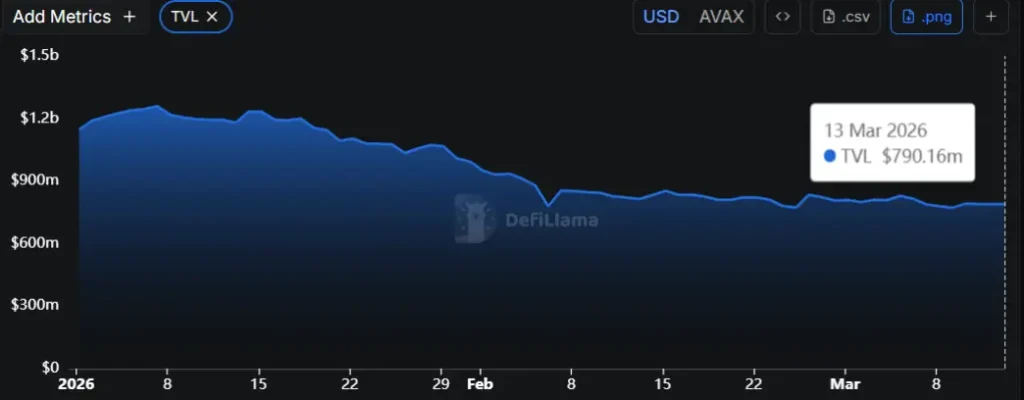
This stagnant trend may indicate a slowing trend in network activity and cautious investor sentiment, as market participants are seemingly unwilling to commit further funds despite ongoing market developments.
$AVAX Price Major Breakout From the Inverted Flag Pattern Formation
Amid the broader market uncertainty, the $AVAX price witnessed a sideways trend around $9 region since early. Interestingly, the consolidation remained strictly within two converging trendlines which indicated the formation of an inverted flag pattern.
The chart setup is characterized by a long downsloping pole indicating sharp correction trend, followed by this short lateral trend to recoup exhausted bearish momentum.
Following the recent market surge, the $AVAX price currently trades at $9.19 mark, challenging the key resistance trendline of flag pattern and 50-day EMA. A bullish breakout from the bearish chart setup is rare but it indicates higher conviction from buyers.
The momentum indicator RSI (Relative Strength Index) at 58% accentuates the improving market sentiment for price recovery. This, a potential breakout will strengthen the buyers grip over this asset and chase the initial target of $11.23.
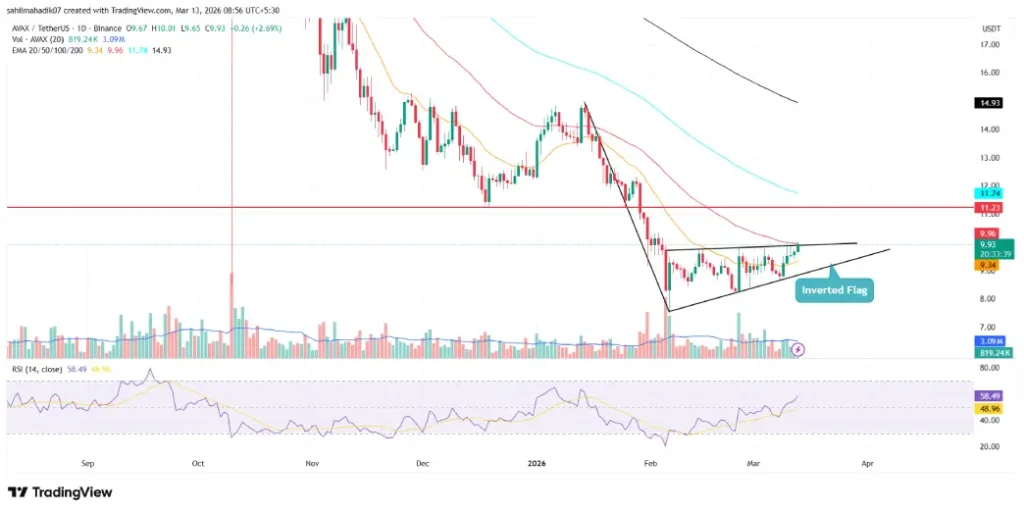
$AVAX/USDT -1d chart
However, the current price upswing is backed by low trading volume, suggesting a lack of strong buying pressure. If the sellers continue to defend the overhead trendline, the SUI price could revert 8.5% and challenge the bottom trendline.
The post-breakout fall may accelerate the selling pressure for an extended correction below $7.5.

 cryptonewsz.com