
The cryptocurrency Shiba Inu ($SHIB) has every chance to finish the second week of March as one of the beneficiaries of the relief rally that we are currently observing on the market. Since the beginning of the week, the token has already added almost 17% to its price and is trading at $0.00000618. For comparison, its value on Monday stood at $0.00000527.
However, as the current picture on the $SHIB price chart by TradingView suggests, the ceiling of growth has not yet been reached. Assessing the price from the perspective of the Bollinger Bands indicator, it can be said that further upside of around 22% still looks realistic for $SHIB.
Why Bollinger Bands signals more gains for Shiba Inu ($SHIB)
These figures are not out of thin air. Specifically, the 20-day moving average on the weekly time frame, which is fundamental for the Bollinger Bands, is currently located about 22% higher.
For those unfamiliar with the indicator, it works as a price corridor that allows one not only to determine which bias is currently prevailing for the asset but also to outline strong resistance and support levels based on historical price data. Supporting the idea that $SHIB may reach this level, which currently comes in around $0.00000760, is also the prevailing trend.
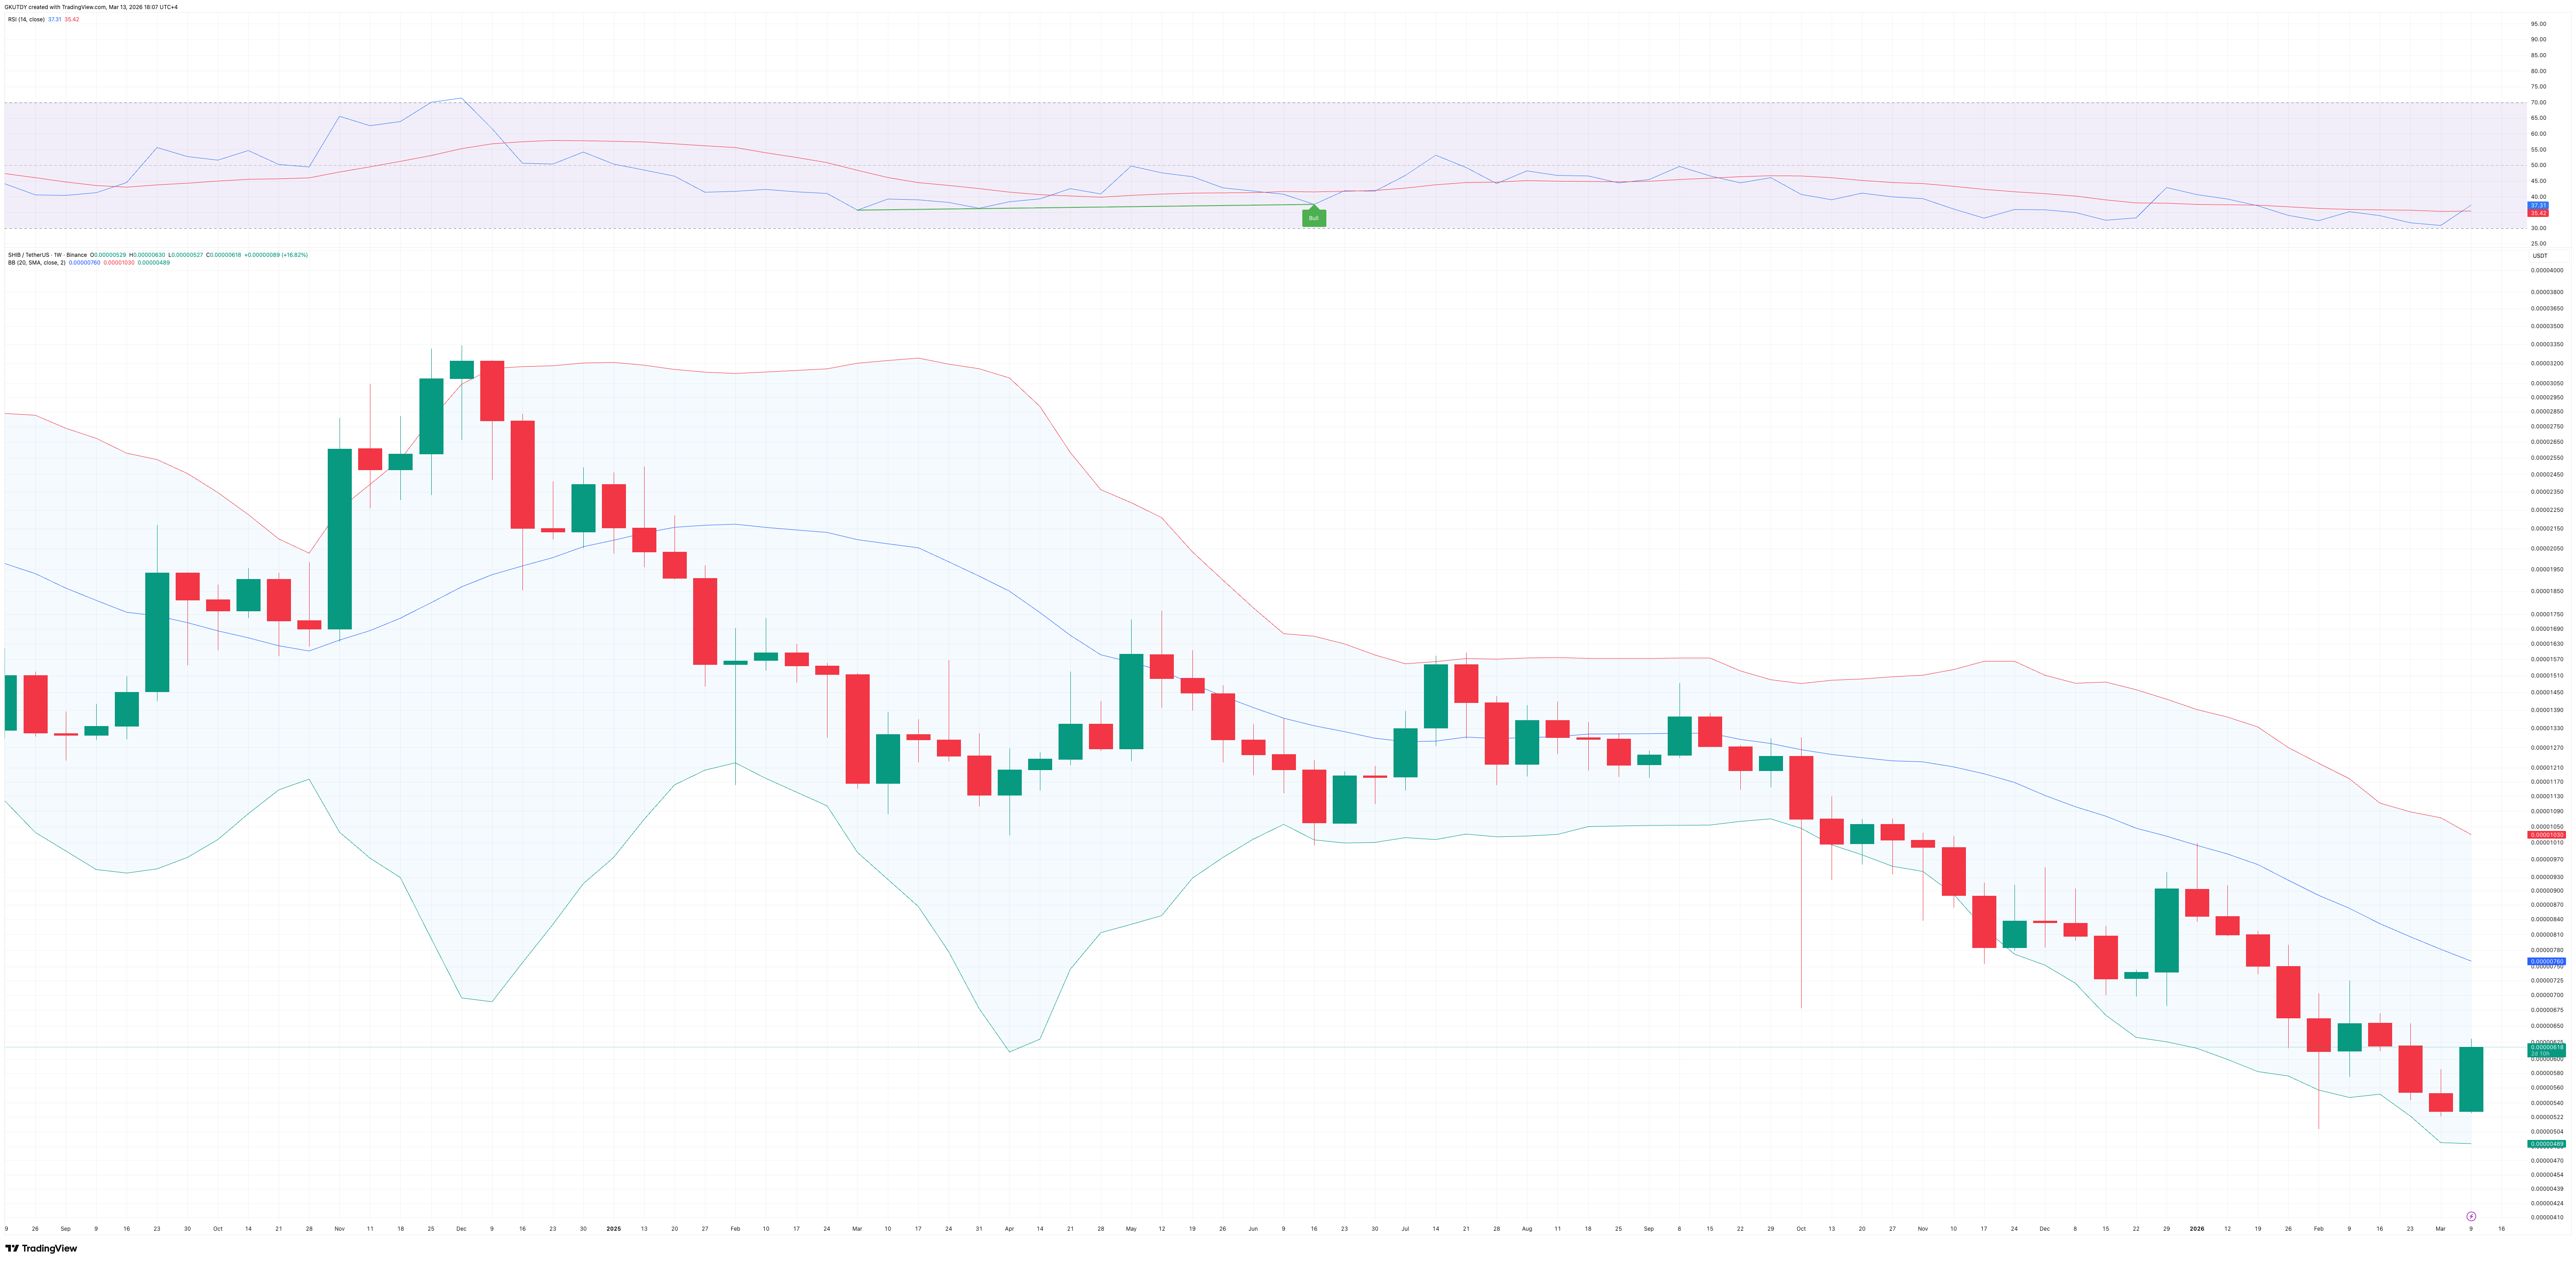
Since the moment Shiba Inu fell into the lower corridor of the Bollinger Bands on the price chart, which happened in September 2025, the token has tested this line twice. The first time was during the week of Oct. 6, and the second during the week of Jan. 5.
Adding fuel to the bullish forecast for $SHIB is the fact that the current week is the most "green" for Shiba Inu. The last time the token demonstrated similar growth figures was during a week in December 2025, when the price of $SHIB increased by 22.3% over seven days.