
Solana price has climbed about 5% in the past 24 hours, drawing fresh optimism across the market. The move follows a bullish momentum signal and a sharp increase in accumulation by mid-term holders. At first glance, the rebound looks healthy.
But a deeper look at the chart and on-chain data reveals a more complicated picture. While some investors are aggressively buying the bounce, other indicators suggest the strength behind the move may not be as solid as it appears.
Bounce Gains Support as EMAs Cross and Holder Buying Surges
One of the main drivers behind Solana’s recent move is a bullish crossover between the 20-period and 50-period exponential moving averages (EMAs) on the 8-hour chart. An EMA tracks average prices while giving more weight to recent movements, helping traders identify momentum shifts.
A similar setup appeared earlier this month. Around March 4, when the same crossover developed, Solana went on to rally nearly 12%.
This time, the crossover started forming again, and since the two EMAs began converging, Solana has already gained roughly 7.45%, suggesting buyers reacted quickly to the signal.
Money flow indicators also appeared supportive. The Smart Money Index, which attempts to track the behavior of experienced traders, recently moved higher and widened its distance from its signal line. This movement usually suggests increasing participation from stronger market participants.

At the same time, mid-to-long-term holders also stepped up their buying. The Hodler Net Position Change metric tracks how many coins are being accumulated by investors holding assets for 155 days or more. Positive values indicate these investors are adding to their positions rather than selling.
On March 10, these holders had accumulated roughly 396,520 $SOL. By March 12, that figure had risen to about 819,634 $SOL, representing a jump of more than 100% in accumulation. On the surface, these signals paint a bullish picture.
 $SOL Mid-To-Long-Term Holders Adding">
Another supportive signal comes from the behavior of short-term holders. Wallets holding Solana for between one week and one month, often considered the most speculative cohort, reduced their share of supply from about 9% on March 7 to roughly 7.31% by March 12.

When speculative supply leaves circulation, it can reduce immediate selling pressure and create room for prices to rebound. But not every metric agrees with that optimistic sentiment.
Beneath the Surface, Divergences and Long-Term Selling Raise Questions
Despite the bullish signals above, deeper Solana indicators reveal emerging contradictions. One example comes from the Smart Money Index itself. While Solana’s price has gradually trended higher since March 1, the Smart Money Index has actually trended lower during the same period.
This mismatch forms a bearish divergence, a situation where price rises but underlying money flow weakens. Such divergences often appear before trend slowdowns or reversals. Plus, the price bounces, triggered by the EMA crossovers, were forming inside a bearish pattern: the head-and-shoulders formation.
Want more token insights like this? Sign up for Editor Harsh Notariya’s Daily Crypto Newsletter here.
Another signal comes from longer-term supply distribution.
Data tracking 1-year to 2-year holders shows that this group has begun reducing exposure. On March 4, this cohort controlled about 16.27% of Solana’s circulating supply. That share has since declined to roughly 15.83%. Although the drop may appear small in percentage terms, it represents a notable shift in supply held by experienced long-term investors.
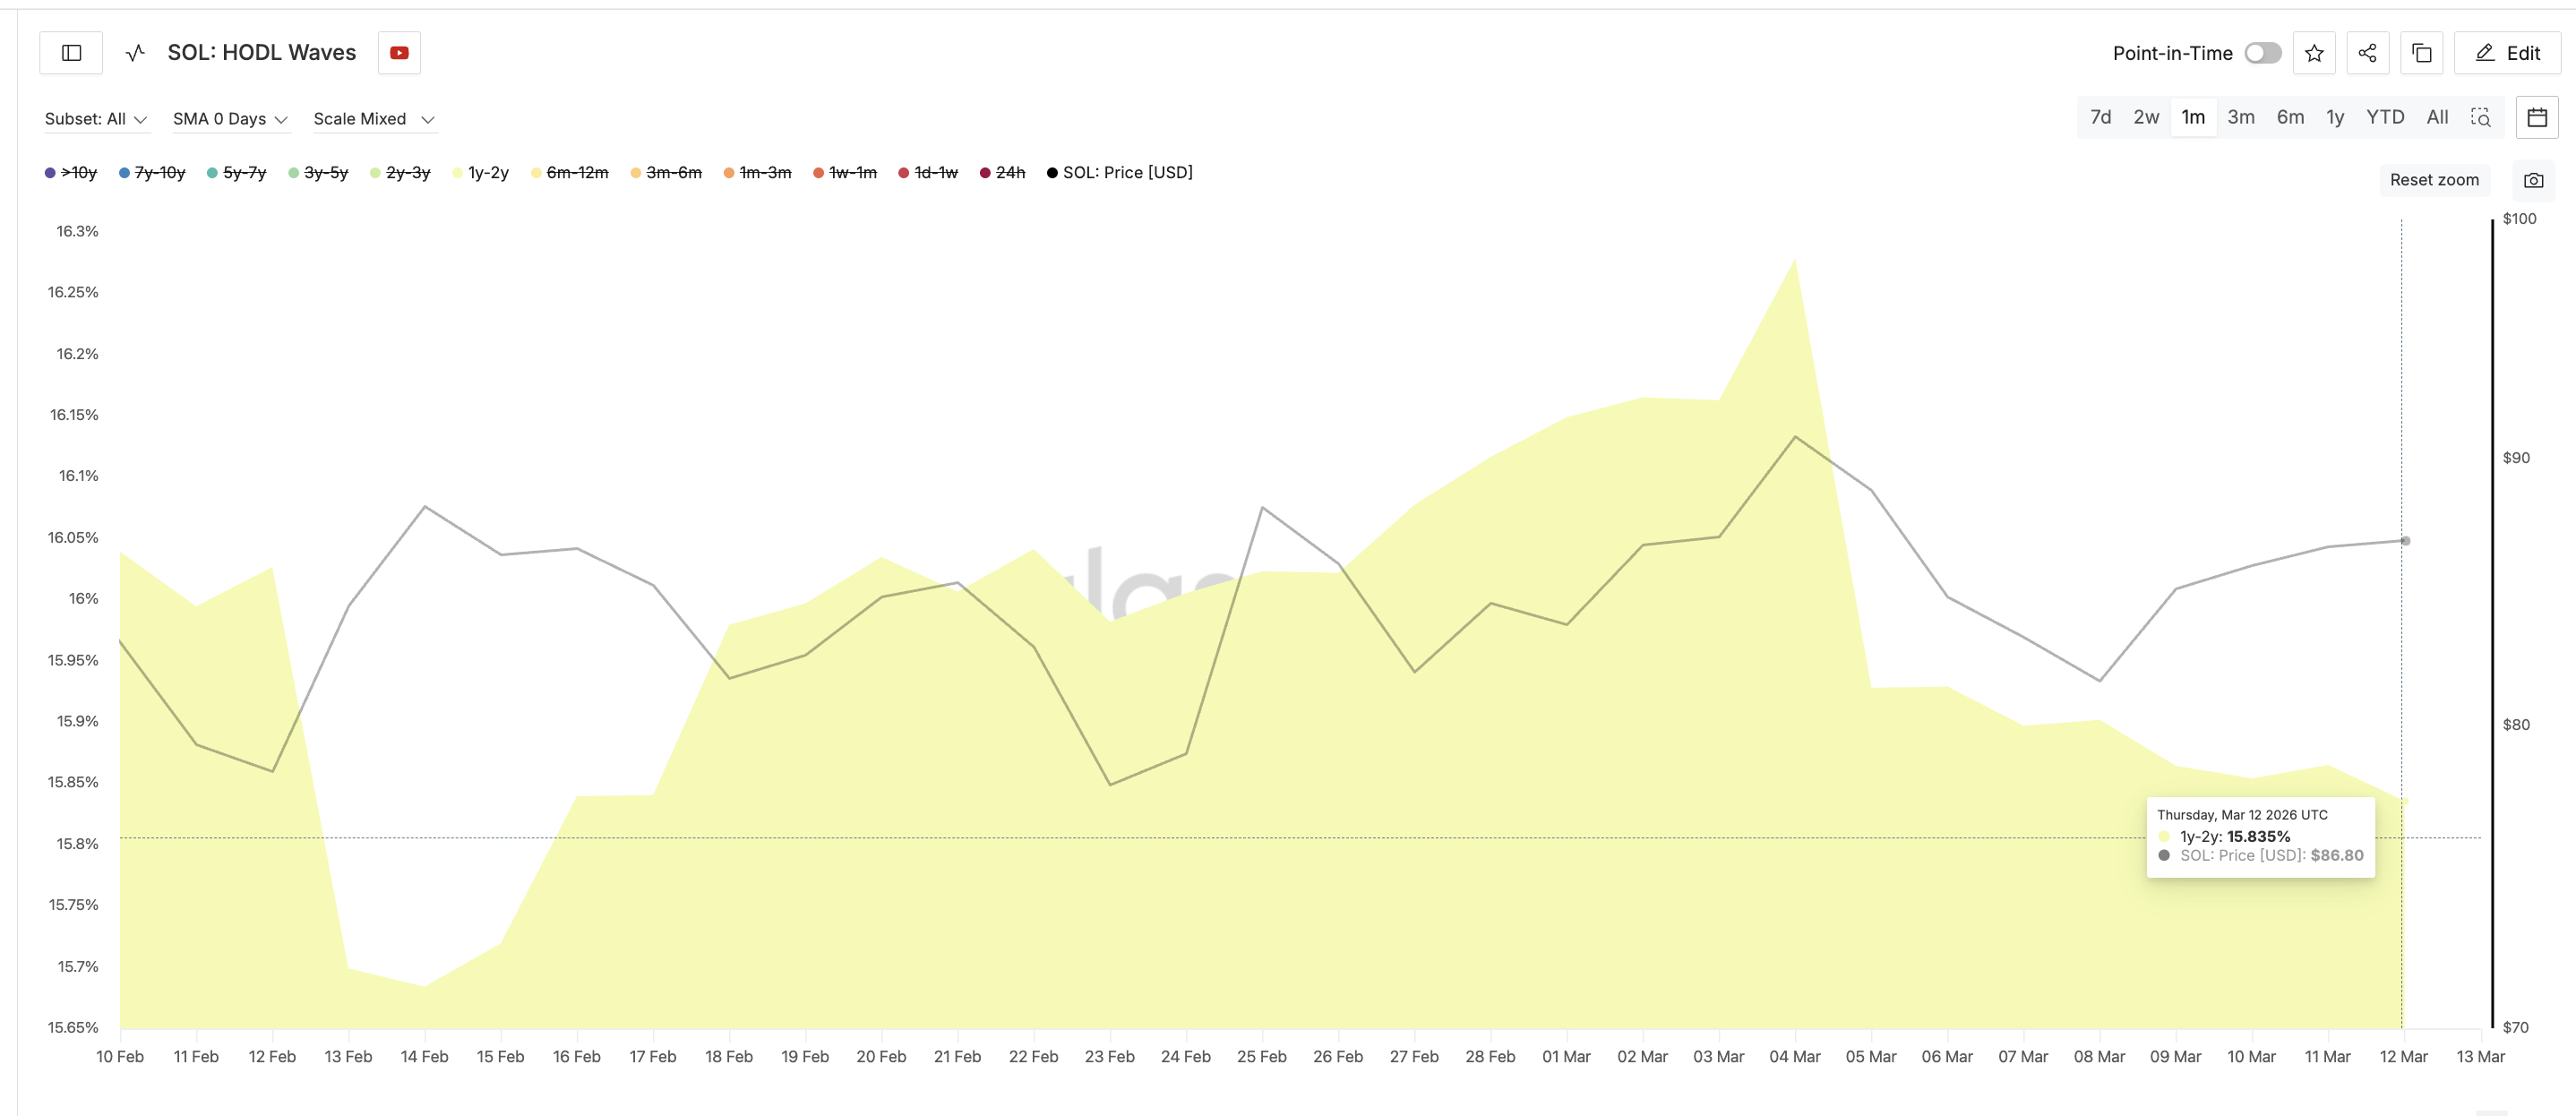
Interestingly, the reduction started around the same time the head (March 4) of a head-and-shoulders pattern formed on the chart. If the pattern completes, it could create downside pressure despite the current rebound.
Solana Price Levels That Will Decide What Happens Next
For now, Solana sits at a technical crossroads. The first major resistance level appears near $91. A clean 8-hour close above this level would weaken the developing bearish structure and suggest the rebound still has momentum.
If Solana manages to break above $94 on the 8-hour chart (the critical test), the head-and-shoulders pattern would likely be invalidated entirely, opening the door for further upside. However, failure to hold current levels could quickly shift the narrative.
If Solana falls below $87, the next downside levels appear near $85, $84, and $82, where buyers previously stepped in. The most critical level sits near $77, which represents the neckline of the head-and-shoulders pattern.
If that neckline breaks, the structure would activate and point to a potential decline of roughly 13%, which could push Solana toward the $67–$68 region.
The post Solana Price Sentiment Faces Test Despite a 100% Jump in Buying Pressure appeared first on BeInCrypto.