The Shiba Inu chart is starting to look “interesting,” as $SHIB has begun knocking at a resistance trendline that has capped its upside since late February.
Amid the ongoing recovery push from the broader crypto market, Shiba Inu ($SHIB) has engineered a rebound effort, taking advantage of the market’s bullish momentum. With this campaign, $SHIB has now begun retesting a crucial resistance trendline that may determine its next direction.
Key Points
- The latest recovery campaign has resulted in four consecutive bullish Shiba Inu daily candlesticks for the first time since September 2025.
- Within this period, $SHIB has gained nearly 13%, as it looks to reclaim the $0.000006 psychological mark for the first time this month.
- Market data shows that Shiba Inu’s upward push has now led to a retest of an important resistance trendline that has capped its upside potential since late February.
- While Shiba Inu has already broken above this trendline, it needs to hold this breakout for the trend to decisively shift in favor of bulls.
- The break above the resistance trendline also aligns with a breakout from a falling parallel channel that had guided $SHIB’s price action throughout this year.
Shiba Inu’s Latest Recovery Effort
Market analyst Crypto Tony identified this bullish positioning in one of his latest analyses, as $SHIB looks to regain some of the losses of the past few weeks. Notably, after a turbulent weekend, $SHIB began this week on a bullish note and has maintained this trend throughout the week.
As a result, Shiba Inu has recorded four consecutive bullish intraday candlesticks for the first time since September 2025, indicating that the uptrend has not faded prematurely like previous ones. Within this period, $SHIB has gained almost 13%, on track to record a fifth straight intraday gain.
$SHIB Retests Crucial Resistance Trendline
Due to the ongoing momentum, Shiba Inu appears to be retesting a crucial resistance trendline that has capped its upside momentum for over two weeks. Specifically, this resistance trendline sits at the $0.0000059 area, and acted as a support region for $SHIB until the meme coin broke below it on Feb. 27, a day before the escalation of the Israel-Iran conflict.

From that point, Shiba Inu had traded below the trendline, and attempts to break above it on March 1 and 4 met resistance from the bears and subsequent pullbacks. At the time of Tony’s analysis, $SHIB was already attempting another breakout, changing hands at $0.000005809.
As a result, the analyst suggested that the Shiba Inu chart was starting to “look interesting.” He emphasized that $SHIB would have to reclaim the $0.0000059 level and hold above it for a “good start,” implying that this could mark the start of a potentially bullish trend flip for the short-term.
Shiba Inu Breaches Resistance Trendline and Falling Channel
At press time, Shiba Inu has already reclaimed the $0.0000059 area, effectively breaking above the resistance trendline. The meme coin now trades for $0.000005974, up 0.65% on the day. With the latest feat, the next task for $SHIB is to hold above this $0.0000059 area, as highlighted by Tony.
Interestingly, data shows that the breach above the resistance trendline also aligned with a breakout from a multi-month descending channel that had dominated the daily chart throughout this year.
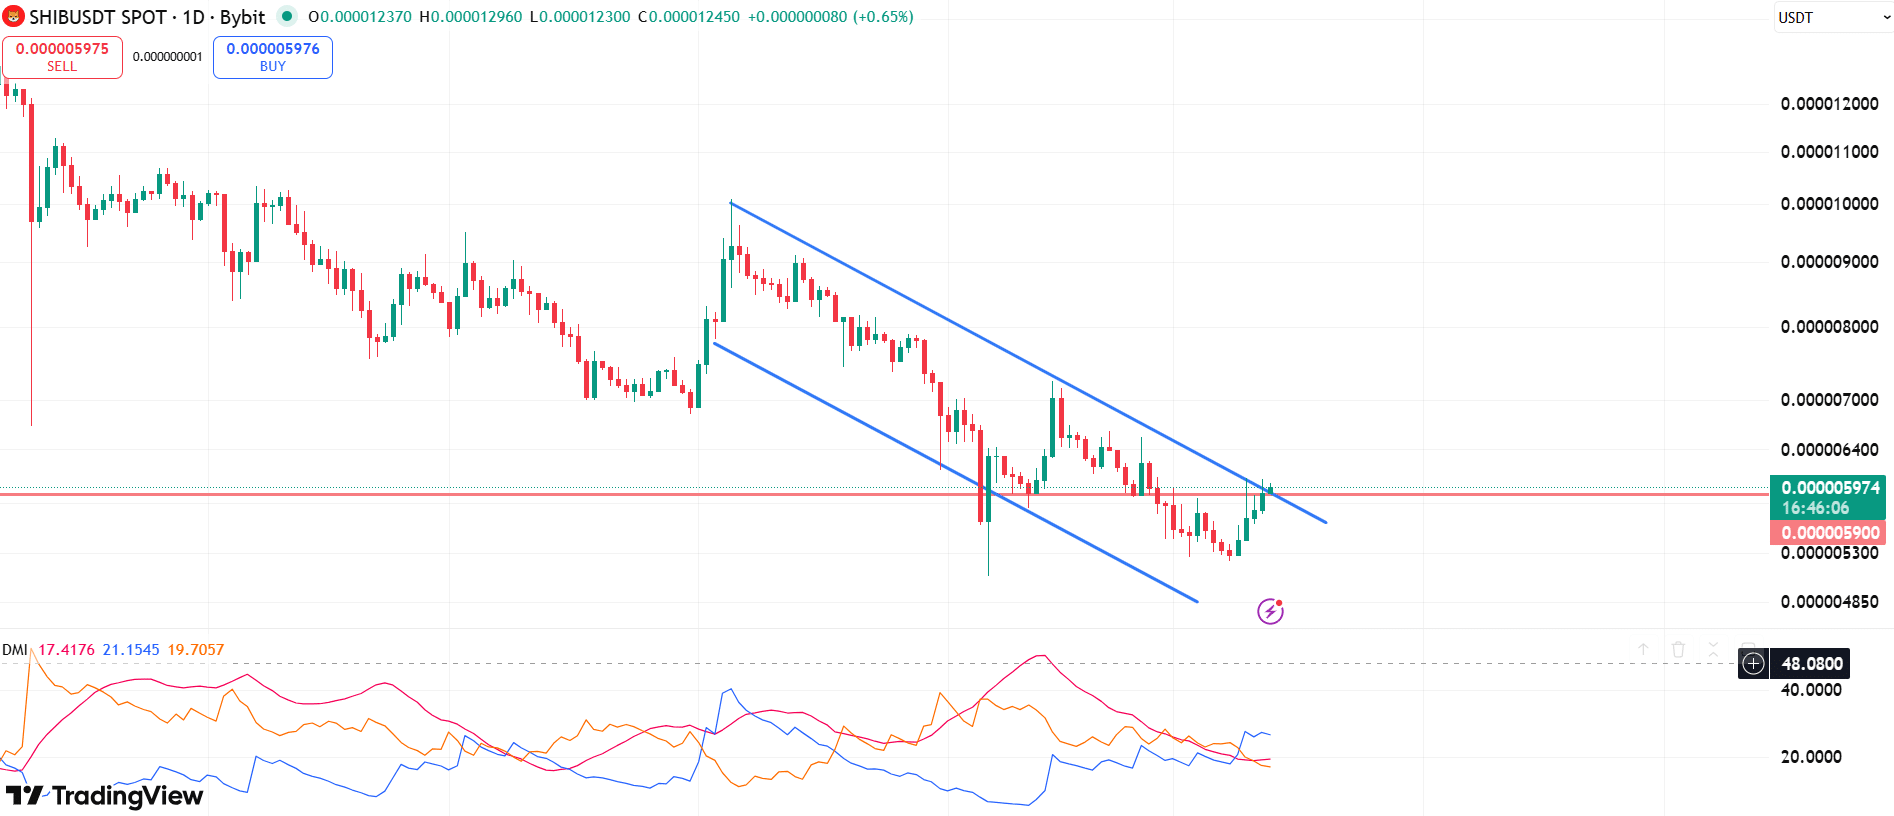
Specifically, the channel started forming after Shiba Inu dropped from the $0.00001 psychologically important mark on Jan. 5 following an impressive run early in the year. After this drop, $SHIB recorded lower highs and lower lows, leading to the formation of the descending channel. The rally above $0.0000059 has now broken above the channel. $SHIB must now hold above this breakout.