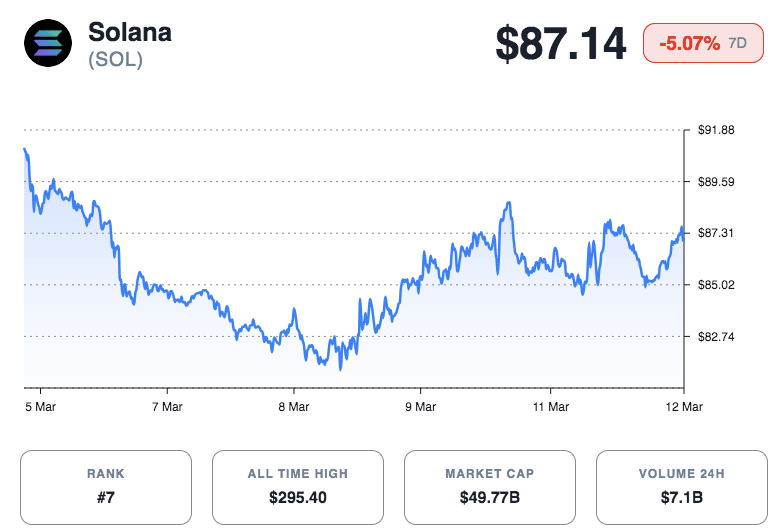
As of press time, Solana trades around $87, with a market capitalization approaching $50 billion. Additionally, daily trading volume recently exceeded $4 billion, reflecting continued investor participation.
Although the token declined nearly 6% during the past week, it gained modestly during the last day. Hence, the market now appears to sit in a period of consolidation as traders evaluate the next directional move.
Tight Bollinger Bands Signal Volatility Ahead
Technical indicators suggest that Solana may soon experience a sharp price shift. Market analyst Ali Martinez highlights a tightening of Bollinger Bands on the daily chart. This pattern often appears when volatility declines before expanding again. Consequently, traders frequently interpret such squeezes as a signal that a significant move may follow.
The chart shows Solana recovering from a prolonged downtrend and stabilizing near $86. Additionally, price action currently sits between strong support around $81 and resistance close to $92. This narrow range reflects balance between buyers and sellers.
If Solana breaks above $92, momentum could push the price toward the $100 psychological level. However, a decline below $81 may open a path toward the $75 support zone.
Liquidation Levels Create Short-Term Pressure
Market positioning may also amplify volatility. Analyst CW8900 identified heavy leveraged positions around two critical levels. High-leverage long positions cluster near $84. At the same time, large short positions sit close to $89.
Moreover, these levels create a potential liquidation battleground. If price swings strongly in either direction, forced liquidations could intensify the move. Consequently, traders continue monitoring trading volume and derivatives data for confirmation signals.
Long-Term Structure Suggests Bullish Potential
Source: X
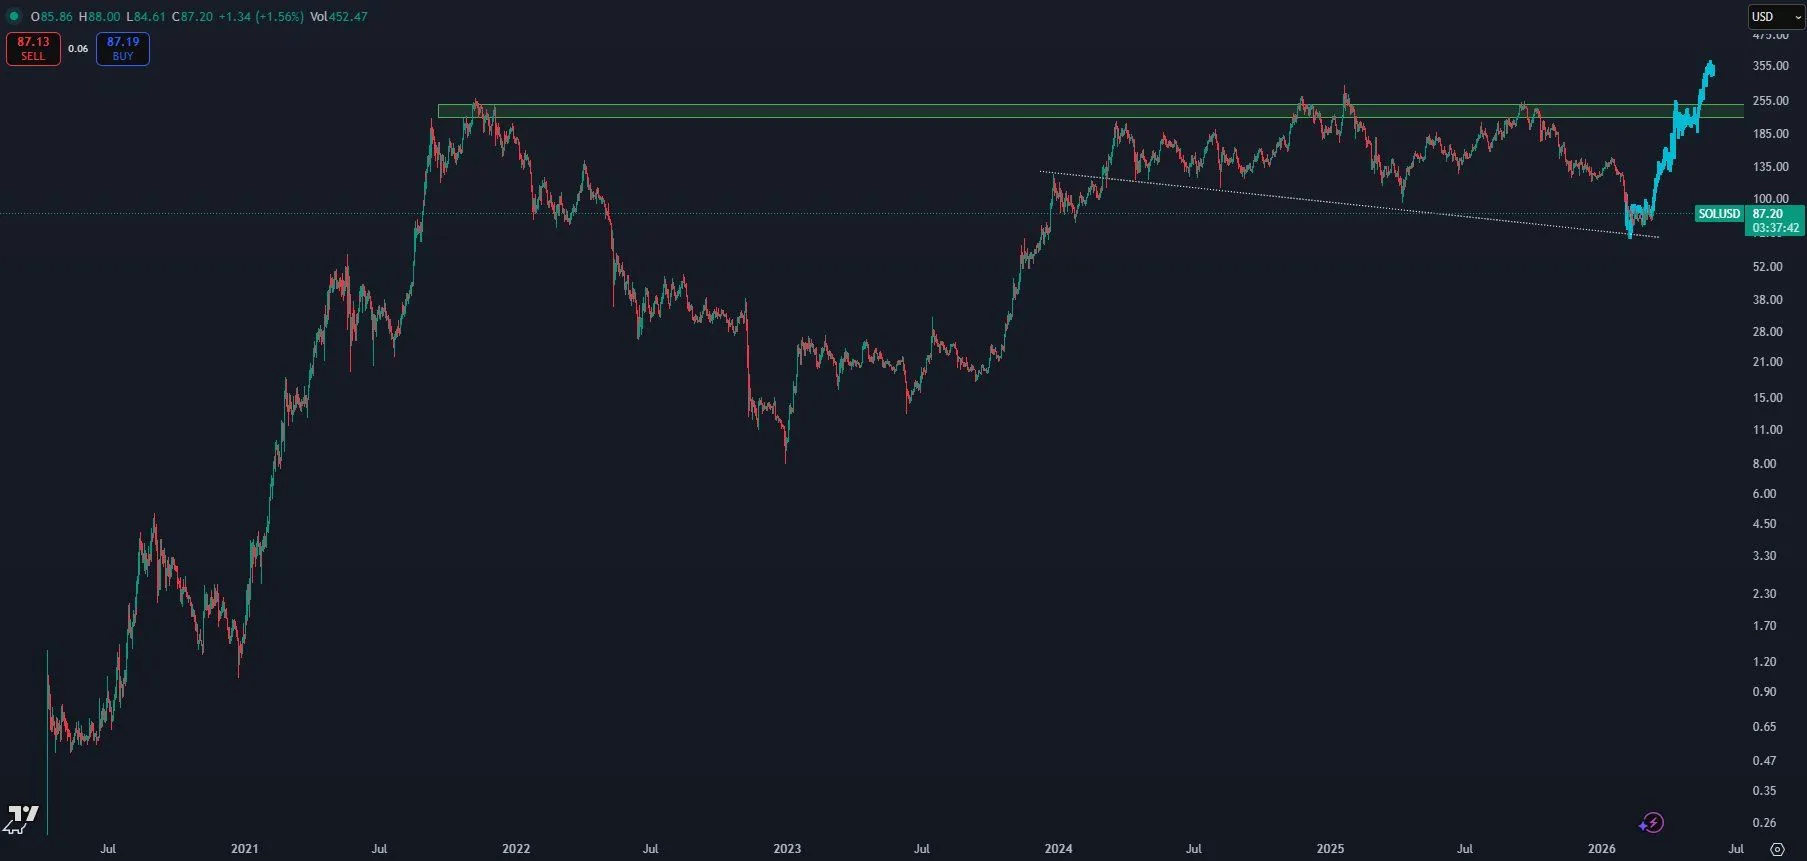
Despite the current consolidation, analysts continue to highlight Solana’s strong long-term structure. CryptoKaleo outlines a multi-year chart showing a massive rally during 2021, followed by a deep bear market. The asset later formed a lengthy base before entering a new uptrend through 2024 and 2025.
Significantly, the previous cycle resistance around $250 to $260 remains a critical level. A confirmed breakout above that zone could open the path toward $300 and beyond.

 coinpaper.com