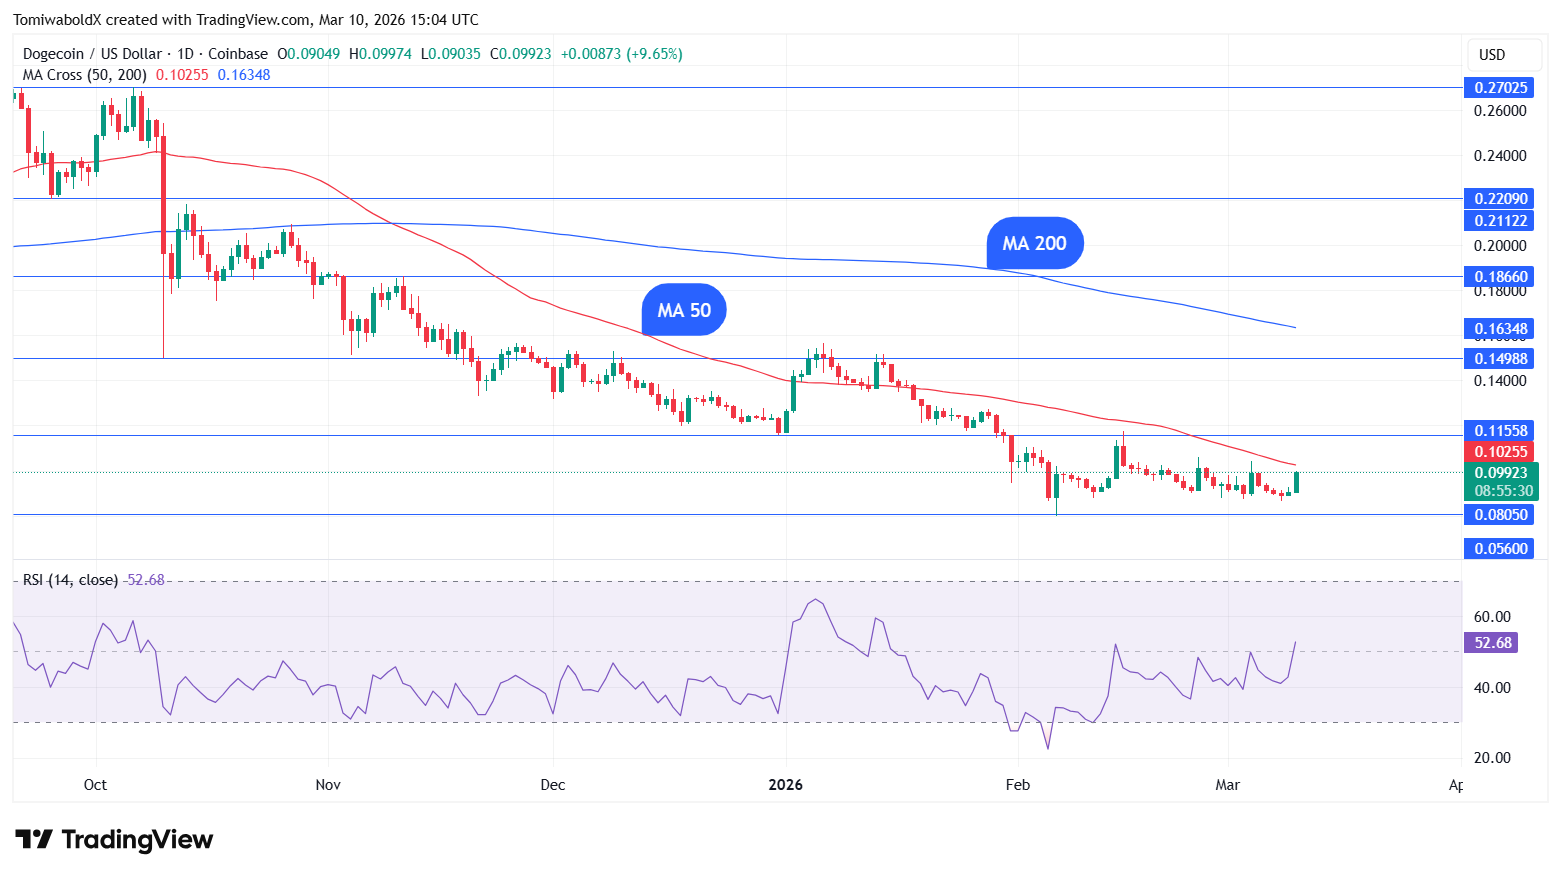
However, the rise could not achieve the $0.10 mark, only reaching $0.0997. A slight barrier is seen above $0.99, as the Dogecoin price retreated from $0.992 on March 5, falling for four straight days.
Even resistance is anticipated slightly higher, above $0.10 at $0.104 and $0.106, with Dogecoin testing these price points on Feb. 25 and March 4, respectively, but had a failed breakout.
Dogecoin price
The daily RSI is slightly above 50, hinting at potential sideways trading and a slight advantage to the bulls.
The same sideways trading scenario is present on the four-hour chart, with the setup leading to a potential 37% move.
According to Alicharts, Dogecoin ($DOGE) is consolidating in a triangle on its short-term charts, setting up for a 37% price move. Ali highlighted a triangle pattern forming on Dogecoin's four-hour chart, with the potential for a 37% move, which will target $1.33 if confirmed.
On-chain and derivatives indicators indicate the market is eyeing stability after the recent sell-off, though conviction is yet to fully return. Analysts believe that the market "already absorbed the negatives and priced them in," with the next move now being awaited.
This week awaits a slew of economic data, with investors bracing for February inflation data due Wednesday, followed by the January personal consumption expenditures index and JOLTS job openings figures on Friday.

 u.today