The $XRP Sharpe Z-Score hits an 8-month peak, suggesting improvement in risk-adjusted performance.
$XRP is going through its longest run of price declines in nearly ten years, having recorded five straight months of losses for the first time since late 2016 to early 2017. The price has dropped 50% during the current period and now trades at $1.4, as retail sentiment turns sour.
Despite this, $XRP’s Sharpe Ratio and Sharpe Z-Score indicators have seen impressive upticks in recent times, suggesting that risk-adjusted sentiments may be improving across the board.
Key Points
- $XRP has recorded five consecutive months of price losses for the first time since 2016 to 2017, shedding 50% of its value to currently trade at $1.4.
- Despite the ongoing price decline, data shows the Sharpe Z-Score has risen to 1.62, its highest reading since last July, as risk-adjusted performance improves.
- The 7-day momentum has turned positive, and the 30-day Sharpe Ratio stands at 0.098, both moving in a direction that suggests early stabilization.
- $XRP still trades below its 200-day moving average of $2.19, and would need to gain 56% just to retest that level.
- When both the Sharpe Ratio and Sharpe Z-Score rise together after a downturn, it aligns with early market stabilization or an accumulation phase.
$XRP Sharpe Z-Score Hits 8-Month Peak
$XRP community figure and market watcher Xaif recently called attention to these metrics. Citing data provided by CryptoQuant analyst Arab Chain, Xaif pointed out that $XRP’s Sharpe Z-Score has climbed to its highest level since last July, now registering a reading of 1.62. This marks an 8-month peak.
In addition to this, the 7-day momentum has turned positive, and the 30-day Sharpe Ratio now sits at 0.098. While Xaif admitted that the Sharpe Ratio at 0.098 represents a small number on its own, he clarified that the direction it is moving remains bullish for prices.
Amid these improvements in risk-adjusted metrics, Xaif stressed that the situation represents evidence of a structure that is slowly but gradually turning. According to him, this sort of directional change tends to appear before the broader market catches on.
$XRP’s 200D MA Remains a Major Hurdle
Despite the encouraging signs, Xaif pointed out that $XRP still trades well below its 200-day moving average, which currently stands at $2.19. For context, $XRP slipped below this pivotal moving average on Oct. 10, 2025, when a broad crypto market crash sent prices tumbling 15.32% in a single day.
From Oct. 26 to 29, 2025, $XRP made several attempts to climb back to the 200-day MA, but sellers turned it away on each try around $2.6. By the close of October 2025, $XRP had fallen firmly below the average and has not come anywhere near retesting it since.
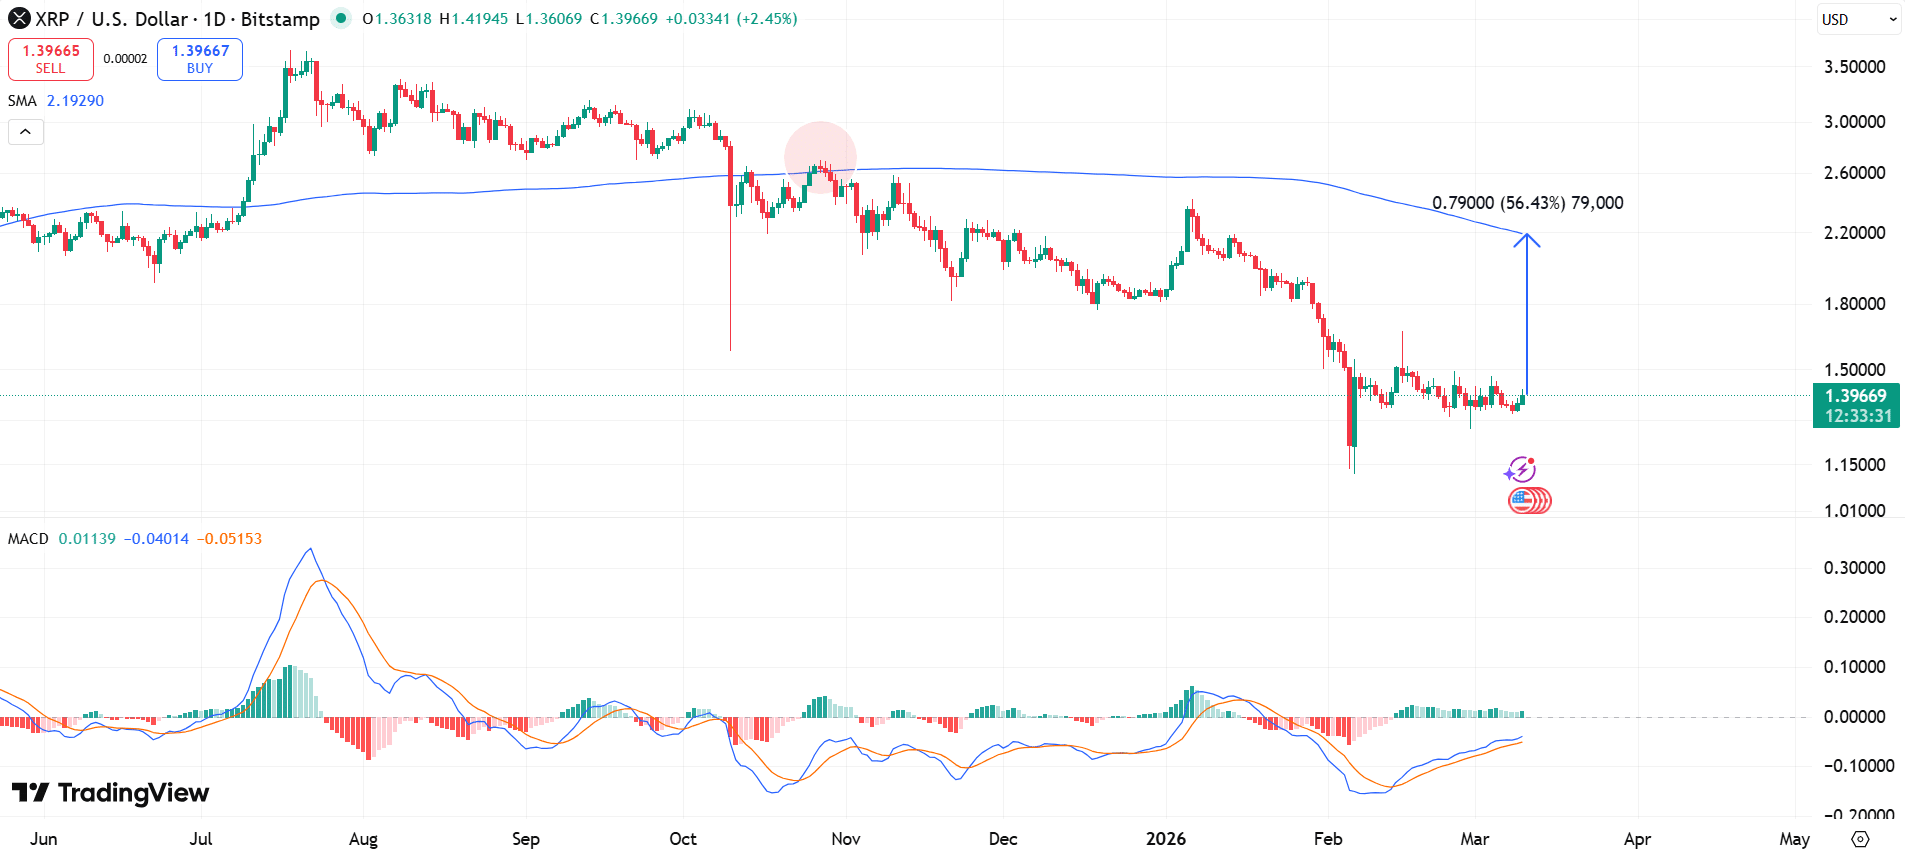
With the token now at $1.4, it would need to rise 56% just to touch the moving average again. Considering the gap between $XRP and the MA, Xaif stressed that the long-term trend has not reversed despite the improving Sharpe Z-Score and that anyone claiming it has is not telling the truth.
What Does This Mean for the $XRP Price?
For the uninitiated, the Sharpe Ratio measures risk-adjusted return by taking an asset’s return, removing the risk-free rate, and dividing the result by the standard deviation of returns. A higher reading tells you the asset is generating better returns for the amount of risk it carries.
Meanwhile, the Sharpe Z-Score compares the current Sharpe Ratio to its own long-term average. This gives market participants a way to judge whether risk-adjusted performance is running unusually strong or weak relative to its own history.
When both metrics start rising together after a downturn, it means returns are growing faster than volatility. This pattern typically shows up in the early stages of market stabilization or an accumulation phase, as the balance between risk and potential reward begins to move in favor of buyers.
Recovery Not Yet Guaranteed
However, Xaif admitted that the current situation does not guarantee a recovery. Instead, he stressed that it may represent a possible turning point for $XRP that the data is beginning to support.
According to him, recoveries do not start when everything looks good, but they start in quiet, low-sentiment moments like this one, when the numbers begin to move while most people are still looking the other way.