
Market conditions remain fragile as Solana price struggles to stabilize in a fearful, Bitcoin-dominated crypto environment.
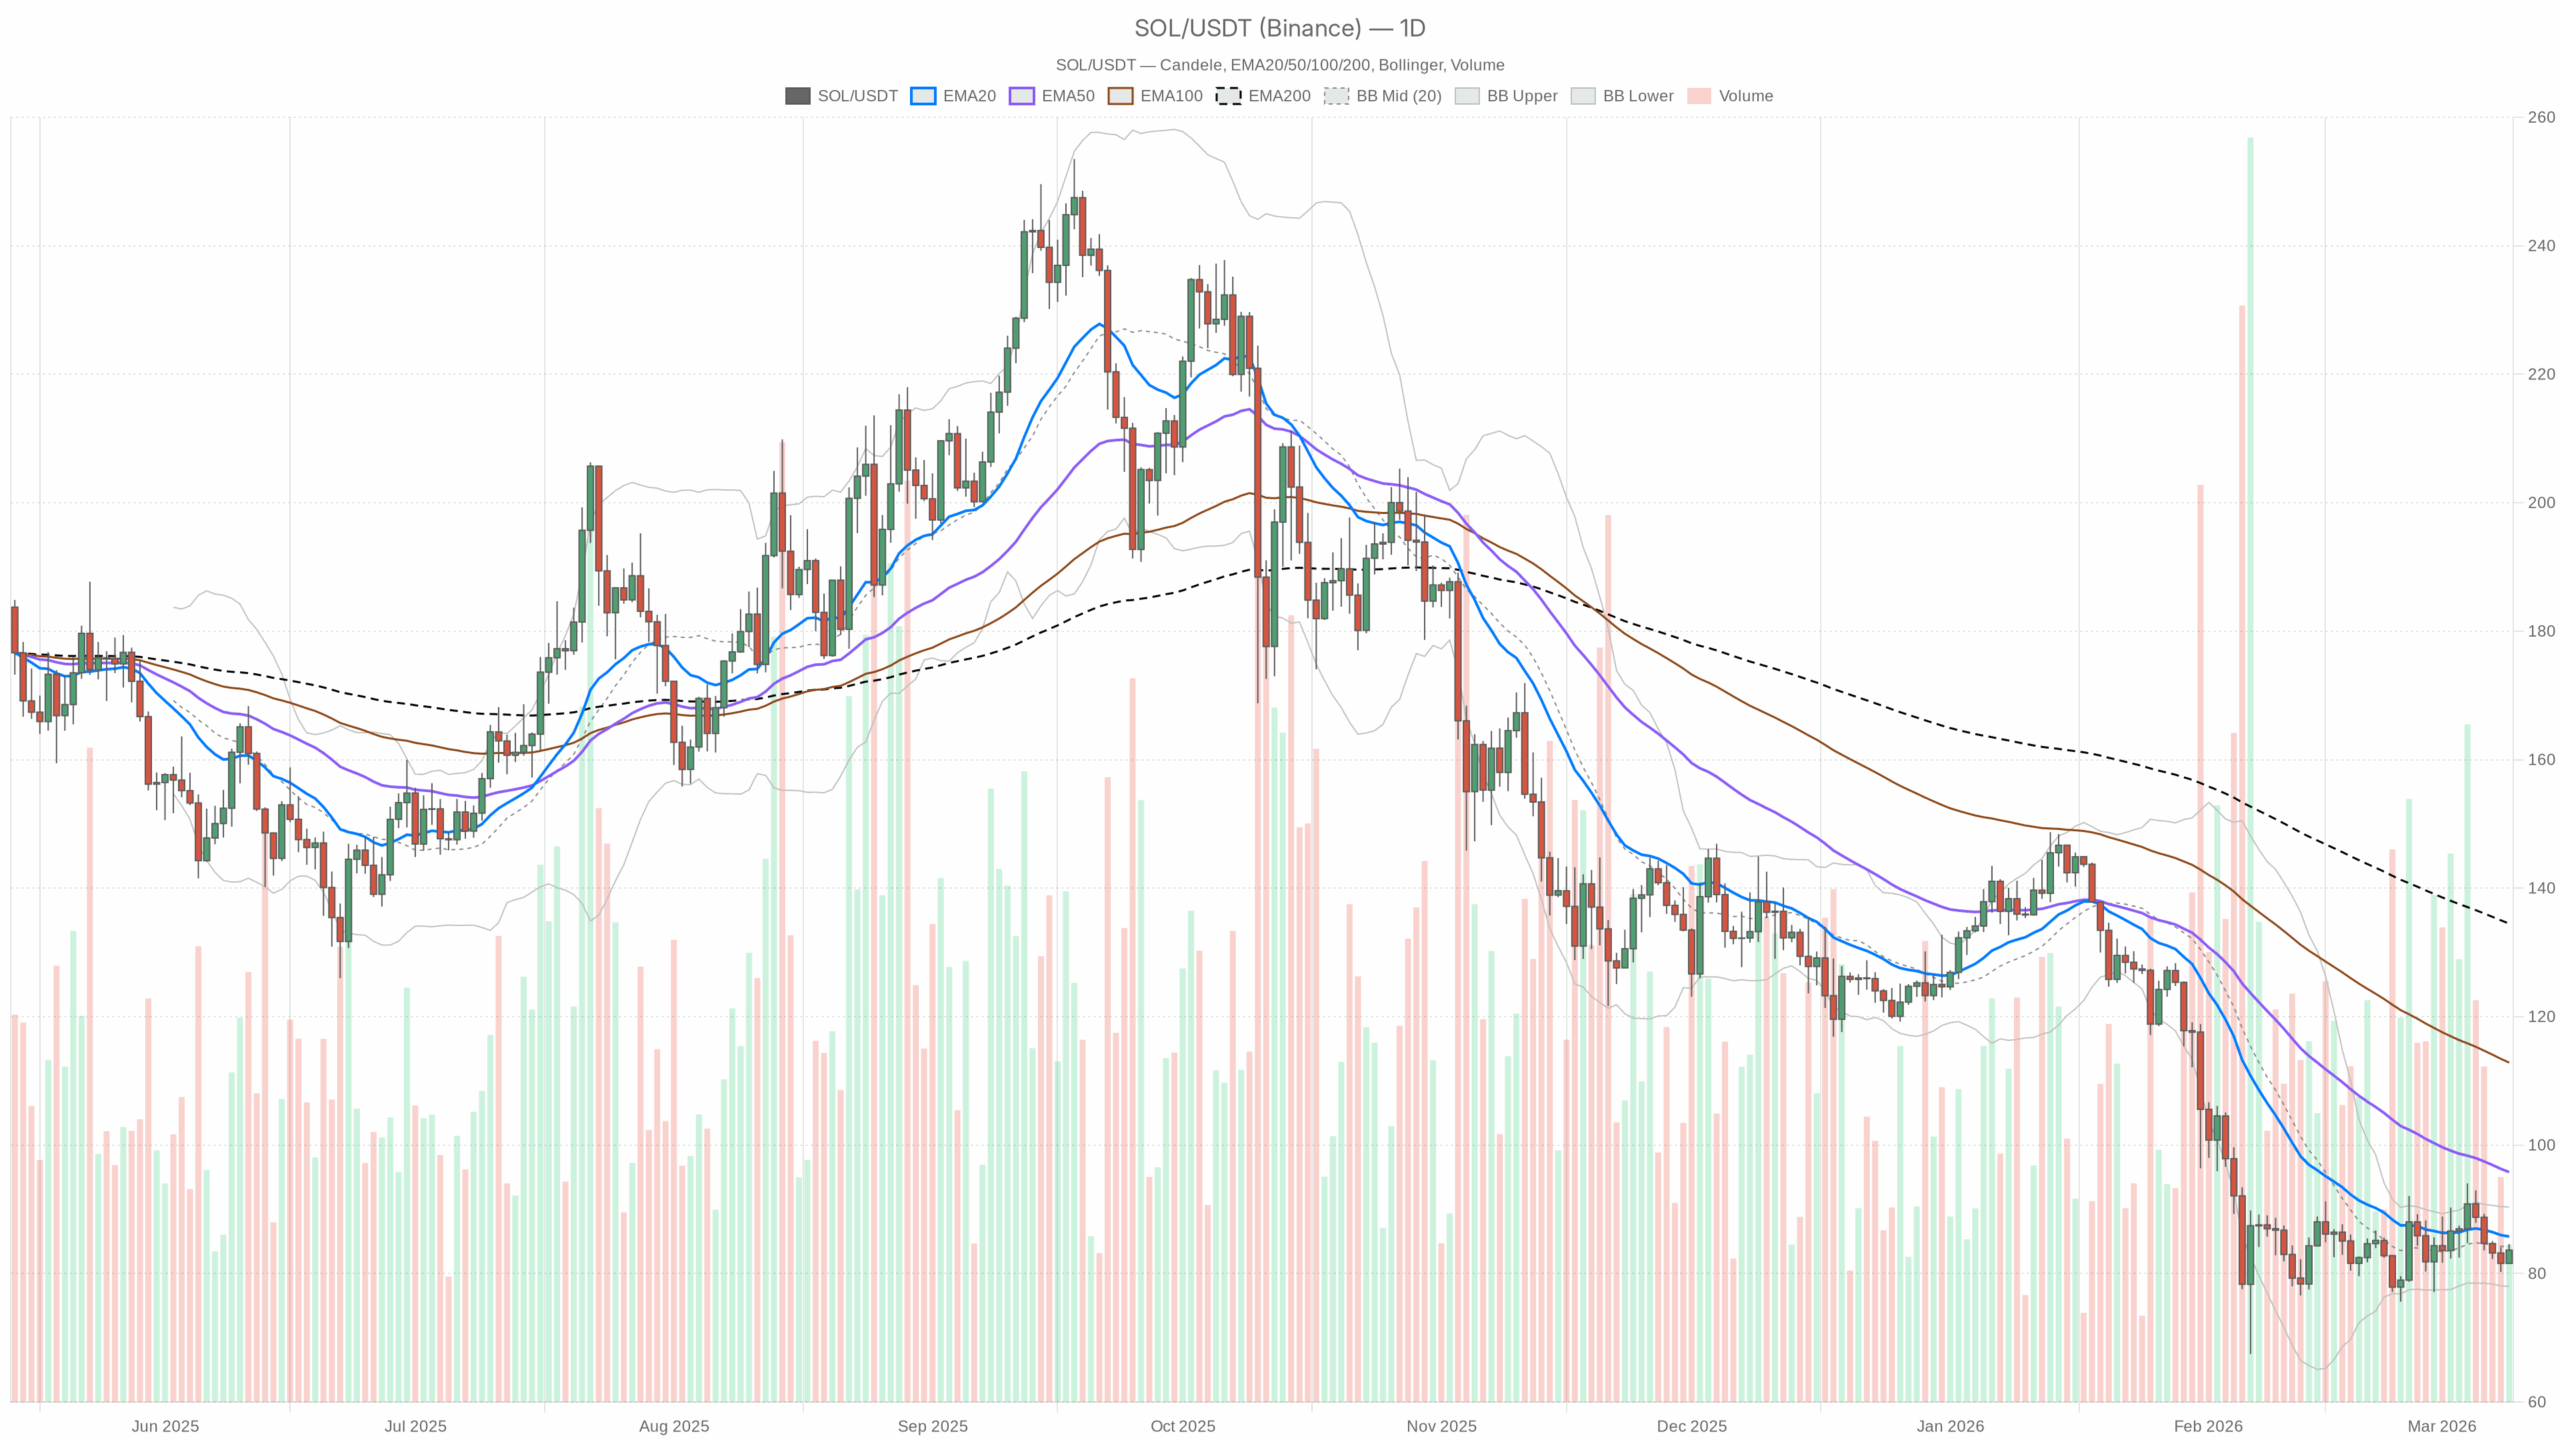 $SOL/$USDT daily chart with EMA20, EMA50 and volume”
loading=”lazy” />
Summary
Market Thesis: Daily Trend Is Still Down, But The Slide Is Losing Momentum
Solana price (SOLUSDT) is trading around $83.6, sitting just under the daily Bollinger midline and below all key moving averages. The bigger picture is still a corrective downtrend, but the intensity of the selloff has clearly cooled. We are in a spot where bears still control the higher timeframe structure, while intraday flows are trying to build a base.
This moment matters because it is the kind of decision zone where either dip buyers finally gain traction for a multi-day rebound, or the market rolls over again and resumes the larger down move. Bitcoin dominance above 56% and a crypto-wide Extreme Fear reading tell you risk appetite for altcoins like Solana is low; any bounce is fighting a defensive, scared market.
Macro Bias from D1: Structurally Bearish, With Early Signs of Stabilization
The daily timeframe defines the main scenario here, and it is bearish. Price is below the 20, 50, and 200-day EMAs, which is classic downtrend territory. However, oscillators and volatility show the sell pressure is no longer one-way traffic.
Daily EMAs (20 / 50 / 200)
- Price: $83.66
- EMA 20: $85.78
- EMA 50: $95.81
- EMA 200: $134.49
Solana is trading below all three EMAs, and the shorter EMAs are stacked under the longer ones. That is a textbook bearish alignment: rallies are, by default, considered bounces inside a downtrend. The gap to the 50 and especially the 200 EMA shows how deep this corrective phase has gone. For now, any push into the low 90s would still sit comfortably under the 50-day and look like mean reversion rather than a trend change.
Daily RSI (14)
- RSI: 44.46
RSI is below 50 but not oversold, which fits a downtrend that is losing momentum rather than an outright capitulation. Sellers are still in charge structurally, but they are no longer pressing the market into extremes. This gives room for a relief rally without contradicting the broader bearish bias.
Daily MACD
- MACD line: -2.59
- Signal line: -3.44
- Histogram: 0.85
The MACD is still below zero but the line is crossing above the signal and the histogram has turned positive. That is what you usually see when downside momentum is fading and the market is trying to base. It does not flip the trend bullish on its own, but it warns that the aggressive part of the selloff is likely behind us unless new negative catalysts show up.
Daily Bollinger Bands
- Middle band: $84.19
- Upper band: $90.36
- Lower band: $78.02
Price is hugging the middle band after trading closer to the lower side earlier in the move. That is typical of a market shifting from trend acceleration to consolidation. The lower band around $78 is the immediate stress point for bulls; the upper band near $90 is the short-term upside envelope for a rebound. Trading near the mid-line says the market is undecided right now, neither squeezing lower nor breaking out.
Daily ATR (14)
- ATR: $6.33
An average daily range of about $6+ is elevated but not extreme. Volatility is still higher than in quiet periods, consistent with a corrective environment, but not at a blow-off level. This means swings can be sharp enough to trap late entries on both sides, but we are not in full panic mode.
Daily Pivot Levels
- Pivot point (PP): $83.27
- R1: $85.00
- S1: $81.93
Solana is trading just above the daily pivot around $83.3, with first resistance at $85 and first support just under $82. Sitting right on top of the pivot usually marks a balance area where neither side has pushed the session decisively yet. A move away from this zone will likely define the current session’s direction: above $85 favors the rebound camp, below $82 puts bears back in control.
Intraday Structure: Short-Term Buyers Testing the Waters
While the daily chart leans bearish, the 1-hour and 15-minute charts show a more constructive tone. This is a classic timeframes conflict: long-term downtrend, short-term attempts at mean reversion. In practice, it means rallies can appear strong intraday but still run into heavy selling at higher levels.
1-Hour EMAs and Regime
- Price: $83.65
- EMA 20: $83.03
- EMA 50: $83.37
- EMA 200: $84.80
- Regime: Neutral
On the 1H chart, price is above the 20 and 50 EMA but still below the 200 EMA. Short-term, buyers have nudged control away from sellers, but they are still capped by the larger intraday trend. This is what you usually see in a bear market rally: intraday momentum flips up, but the ceiling (200 EMA) stays intact until a much more aggressive push.
1-Hour RSI (14)
- RSI: 55.94
RSI slightly above 50 on the hourly chart shows modest bullish momentum. Buyers are active, but far from overheated. There is room for another leg up intraday before conditions look stretched.
1-Hour MACD
- MACD line: 0.25
- Signal line: 0.04
- Histogram: 0.20
The 1H MACD is above zero with a positive histogram, confirming the short-term upward bias. This lines up with price being above the short EMAs. Together, they say the path of least resistance intraday is slightly higher, at least until the price meets the 200 EMA or a major resistance.
1-Hour Bollinger Bands
- Middle band: $82.65
- Upper band: $84.31
- Lower band: $80.99
Price is trading between the middle and upper bands, which is consistent with a gentle upward drift rather than a squeeze. As long as Sol stays above the mid-band, around $82.7, intraday bulls keep the upper hand. A clean rejection from the upper band combined with a drop below the mid-band would be your early sign that this hourly bounce is running out of steam.
1-Hour ATR (14)
- ATR: $1.23
Hourly ATR just above $1 says the average swing per hour is meaningful but not chaotic. There is enough volatility to reward active traders, but it is not the kind of environment where price jumps $5 in a single candle on normal flow.
1-Hour Pivot Levels
- Pivot point (PP): $83.82
- R1: $84.09
- S1: $83.37
On the 1H, Solana is hovering just below its pivot at $83.82. Immediate resistance is tight at $84.1, with support closer to $83.4. Staying pinned between these levels highlights the current range-bound intraday character. A sustained move above $84.1 would reinforce the short-term bullish bias; losing $83.4 would hand back control to sellers for the session.
15-Minute Execution Context
- Price: $83.71
- EMA 20: $83.66
- EMA 50: $83.25
- EMA 200: $83.36
- RSI: 52.64
- MACD line: 0.20
- Signal: 0.23
- Histogram: -0.02
- BB mid: $83.61
- BB upper: $84.44
- BB lower: $82.77
- ATR: $0.44
- Pivot PP: $83.65 (R1: $83.77, S1: $83.60)
On the 15-minute chart, price is basically glued to the 20 EMA, just above the 50 and 200 EMAs, with RSI around 53 and a nearly flat MACD histogram. That is short-term equilibrium: micro bulls have a slight edge, but there is no strong push either way. The tight 15-minute pivot band, between $83.6 and $83.8, underlines that this is a chop zone where scalpers dominate and larger moves are still being prepared, not executed.
Market Backdrop: Altcoins Under Pressure, Sentiment Max Fear
The wider crypto market cap is around $2.4T with a marginal 24-hour pullback and a big spike in volume. Bitcoin dominance sits above 56%, while the fear and greed index is at 8 (Extreme Fear). That combination usually means the market is in a defensive stance, with capital crowding into BTC and stablecoins and being very selective on alt exposure.
Solana still holds about 2% of total crypto market cap, and Sol-related DeFi venues like Raydium and Orca show daily fee rebounds, but their 7–30 day fee trends are sharply lower. That is consistent with cooling speculative activity on the network: the chain is not dead by any means, but the frenzy phase is behind us for now. It all reinforces the idea that rallies on this asset are more likely to be sold into unless broader risk appetite improves.
Bullish Scenario for Solana Price
For bulls, the current setup is about turning a stabilizing downtrend into a tradable relief rally.
On the higher timeframe, the first job is to hold above the daily lower band and S1 support zone around $78–82. As long as $78 stays intact, you can argue that Sol is building a base rather than entering a new leg lower. The daily MACD curling up and RSI hovering in the mid-40s are consistent with that base-building narrative.
On the 1H and 15-minute timeframes, bulls need to convert the current neutral intraday structure into a clear move up. That means:
- Reclaiming and holding above the hourly pivot and R1, between $83.8 and $84.1.
- Pressing into the 1H 200 EMA, around $84.8, and eventually breaking and sustaining above it.
- On the daily, pushing price through the EMA 20, near $85.8, and then towards the upper Bollinger band, around $90.
If Solana can close multiple days above the $86–90 region with the daily RSI crossing back above 50 and MACD getting closer to zero, the conversation shifts from a simple bounce to a more durable recovery. In that case, the next area of interest would be the 50-day EMA around $96–100, where medium-term sellers are likely waiting.
What invalidates the bullish scenario? A decisive break and daily close below the $78–80 region, especially if it comes with a fresh drop in RSI toward oversold and a renewed expansion of the lower Bollinger band. That would tell you the base idea was wrong and the downtrend has resumed with force.
Bearish Scenario for Solana Price
For bears, the main argument is still simple: the daily trend is down and Solana is trading under all key EMAs in an environment of extreme fear and high Bitcoin dominance. From that perspective, current strength is just a pause or a short-covering bounce within a larger slide.
The cleanest bearish roadmap is:
- Failing to break materially above the daily EMA 20, around $86, and the 1H 200 EMA, close to $85.
- Hourly and 15-minute RSI rolling back under 50 with MACD flipping negative again.
- A loss of the daily pivot and S1 levels, at $83.3 and $81.9, opening the door toward the lower band support near $78.
If Solana breaks below $78 with expanding ATR and a widening lower Bollinger band, the next phase is likely a trend extension move, where dips are sold quickly and the market hunts for a deeper support area. In such a scenario, the daily EMAs remain firmly above price and act as strong overhead resistance on any bounce.
What invalidates the bearish scenario? Multiple daily closes above the EMA 20 and a clear push toward, and eventually above, the EMA 50 around the mid-90s. If that happens with daily RSI back over 55 and MACD approaching or crossing above zero, the dominant downtrend claim loses credibility, and bears have to concede that the market has shifted into at least a medium-term range or early uptrend.
How to Think About Positioning Right Now
Solana is in a classic timeframe conflict: the daily chart is still bearish, while intraday charts lean cautiously bullish. That blend usually favors tactical, short-term trades over strong directional bets. Trend traders who respect the daily structure will see bounces toward $86–90 as potential areas where supply reappears. Mean-reversion or short-term traders will focus on the hourly and 15-minute signals around the pivot bands to play the ranges.
Volatility is moderate-to-high, and sentiment is deeply fearful, which is the type of backdrop where moves can overshoot both ways. Solana price can squeeze higher simply because positioning is too defensive, but sustained upside still has to fight the weight of the higher-timeframe downtrend and weak altcoin risk appetite.
Whichever side you lean toward, the key is to stay data-driven and flexible: watch how price behaves around $82 on the downside and $86–90 on the upside. Those zones will tell you whether this is just another bounce in a bear phase or the starting point of a more meaningful recovery.