
Amid a broader market consolidation, Shiba Inu is eyeing a brief price rebound after a double bottom formation on lower timeframes.
Shiba Inu ($SHIB) has recently shown signs of stabilization, hovering around $0.00000533 at the time of writing. While the broader sentiment remains bearish, the prominent meme coin has held above support levels and appears to be range-bound, a departure from the earlier price decline toward newer lows.
Key Points
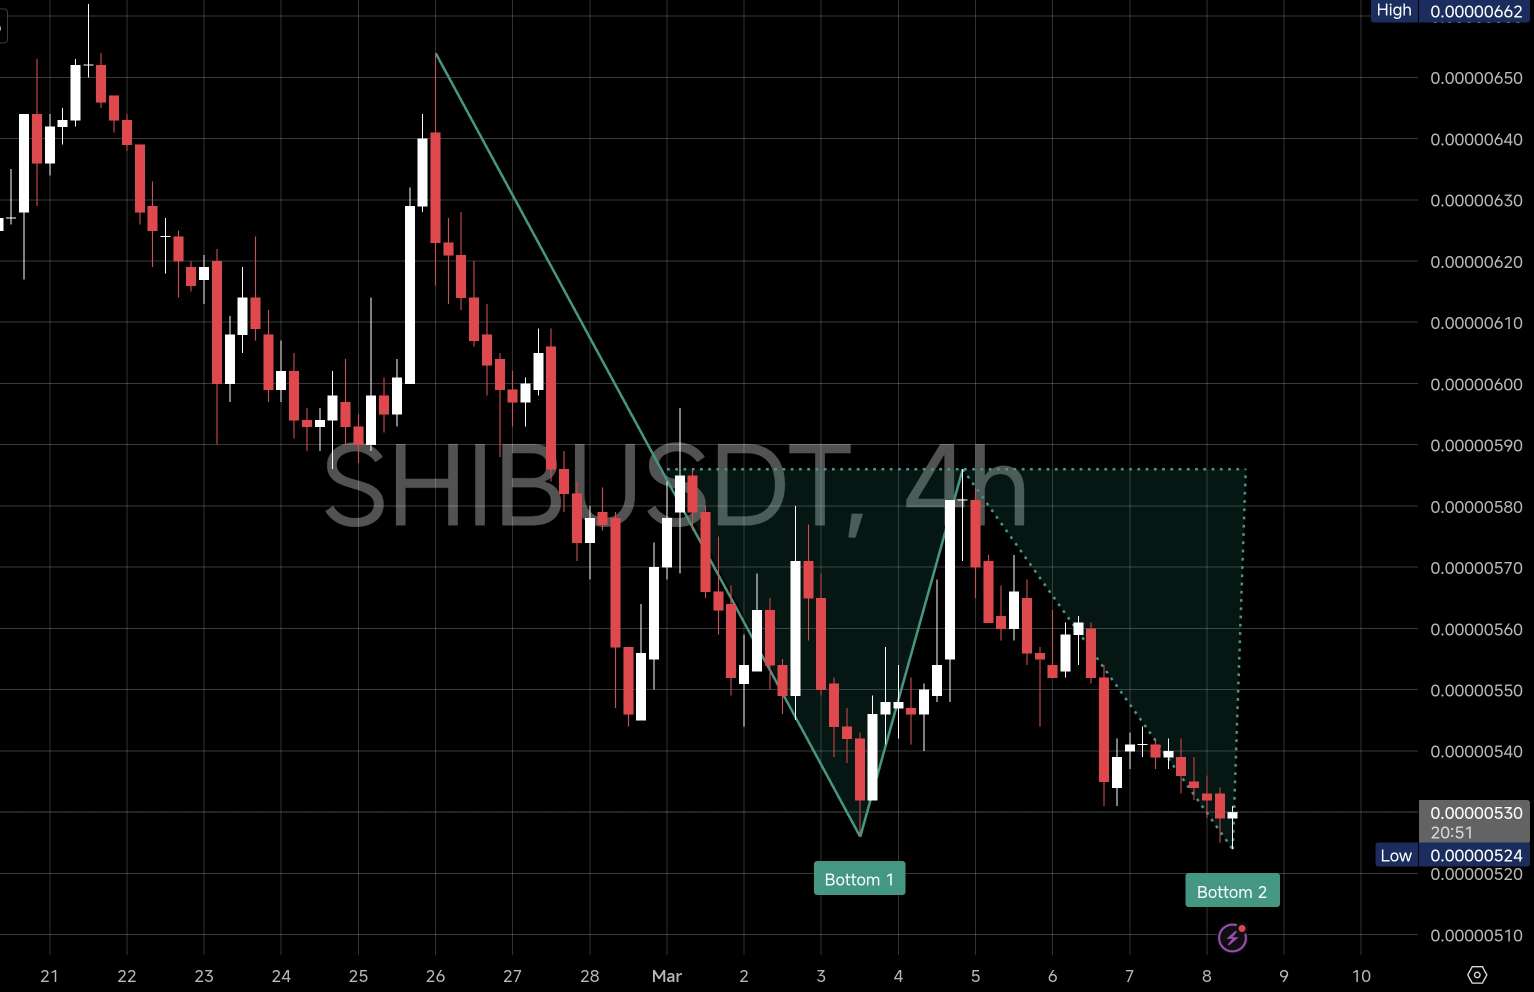
- On the 4-hour chart, Shiba Inu is starting to show bullish signs after repeatedly reacting to a narrow support range between $0.00000524 and $0.00000530.
- Price movement suggests a possible double-bottom formation after Shiba Inu formed an initial low at $0.00000526 on March 2 before briefly recovering.
- On March 8, the token formed a second bottom, dipping to $0.00000523 on Sunday before closing the week slightly higher at $0.00000529.
- If the pattern continues to develop, Shiba Inu could attempt a move toward the closest resistance area around $0.00000555 to $0.00000565.
- A decisive move below the $0.00000520 support level would invalidate the pattern.
Shiba Inu Holds Support
On the 4-hour chart, Shiba Inu is starting to show bullish signs. After repeatedly reacting to a narrow support range between $0.00000524 and $0.00000530, the token could now forge higher. Notably, this zone has recently served as a crucial demand area, with buyers stepping in after the asset declined during the previous downward phase.
Meanwhile, price movement around this level now suggests a possible double-bottom structure. For context, Shiba Inu formed an initial low near the support region when it dropped to $0.00000526 on March 2 before briefly recovering.
The recovery pushed $SHIB to a high of $0.00000586 a day after, before the bullish momentum stalled. On March 8, the token returned to the same support zone and formed a second bottom. It dipped to $0.00000523 on Sunday but closed the week slightly higher at $0.00000529.
Technical structures indicate that when two lows appear in similar locations, with the price continuously rebounding from those lows each time, the pattern is a potential signal that selling pressure may be weakening and accumulation is strengthening.
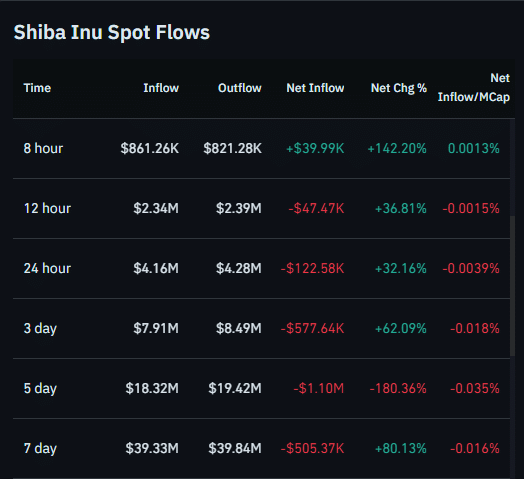
Interestingly, on-chain data backs this sentiment. Coinglass shows stronger spot outflows from exchanges compared to inflows, suggesting that holders are moving to self-custody platforms for longer-term holding. In the past 5 days, inflows stand at $18.32 million, while users withdrew $19.42 million in the same time frame.
Double-Bottom Structure Forms
Meanwhile, following the second reaction near support, $SHIB has started to edge slightly higher. This early bounce indicates that buyers are attempting to defend the area once again. The move has remained modest so far, with a 2% rise from the Sunday lows. However, the momentum suggests that the support zone continues to attract demand.
If the pattern continues to develop, Shiba Inu could attempt a move toward the closest resistance area around $0.00000555 to $0.00000565. This region previously acted as a short-term supply zone where upward movement slowed on March 6. As a result, it may represent the first test for buyers trying to extend the recovery.
Should momentum continue to build beyond that point, the next resistance area could appear closer to the $0.00000580 to $0.00000590 range. From the current market standing, the token would have to increase by 8.8% and 10.7% to reach these price zones.
Shiba Inu Needs Stability Around This Support
Despite the developing pattern, the structure still requires confirmation. Double-bottom formations generally become more reliable when the price continues to hold above the base level and gradually moves toward higher resistance zones.
For Shiba Inu, the critical factor remains the stability of the support area around $0.00000520. If it maintains its price trend above that region, the current base could provide a foundation for sustained upward movement in the near term.
However, a decisive move below this support level would invalidate the pattern. In such a scenario, selling pressure could return quickly, potentially pushing the price toward the $0.00000500 region or even lower levels. Shiba Inu last tested the $0.0000050 region during the broader crypto market crash on February 6.