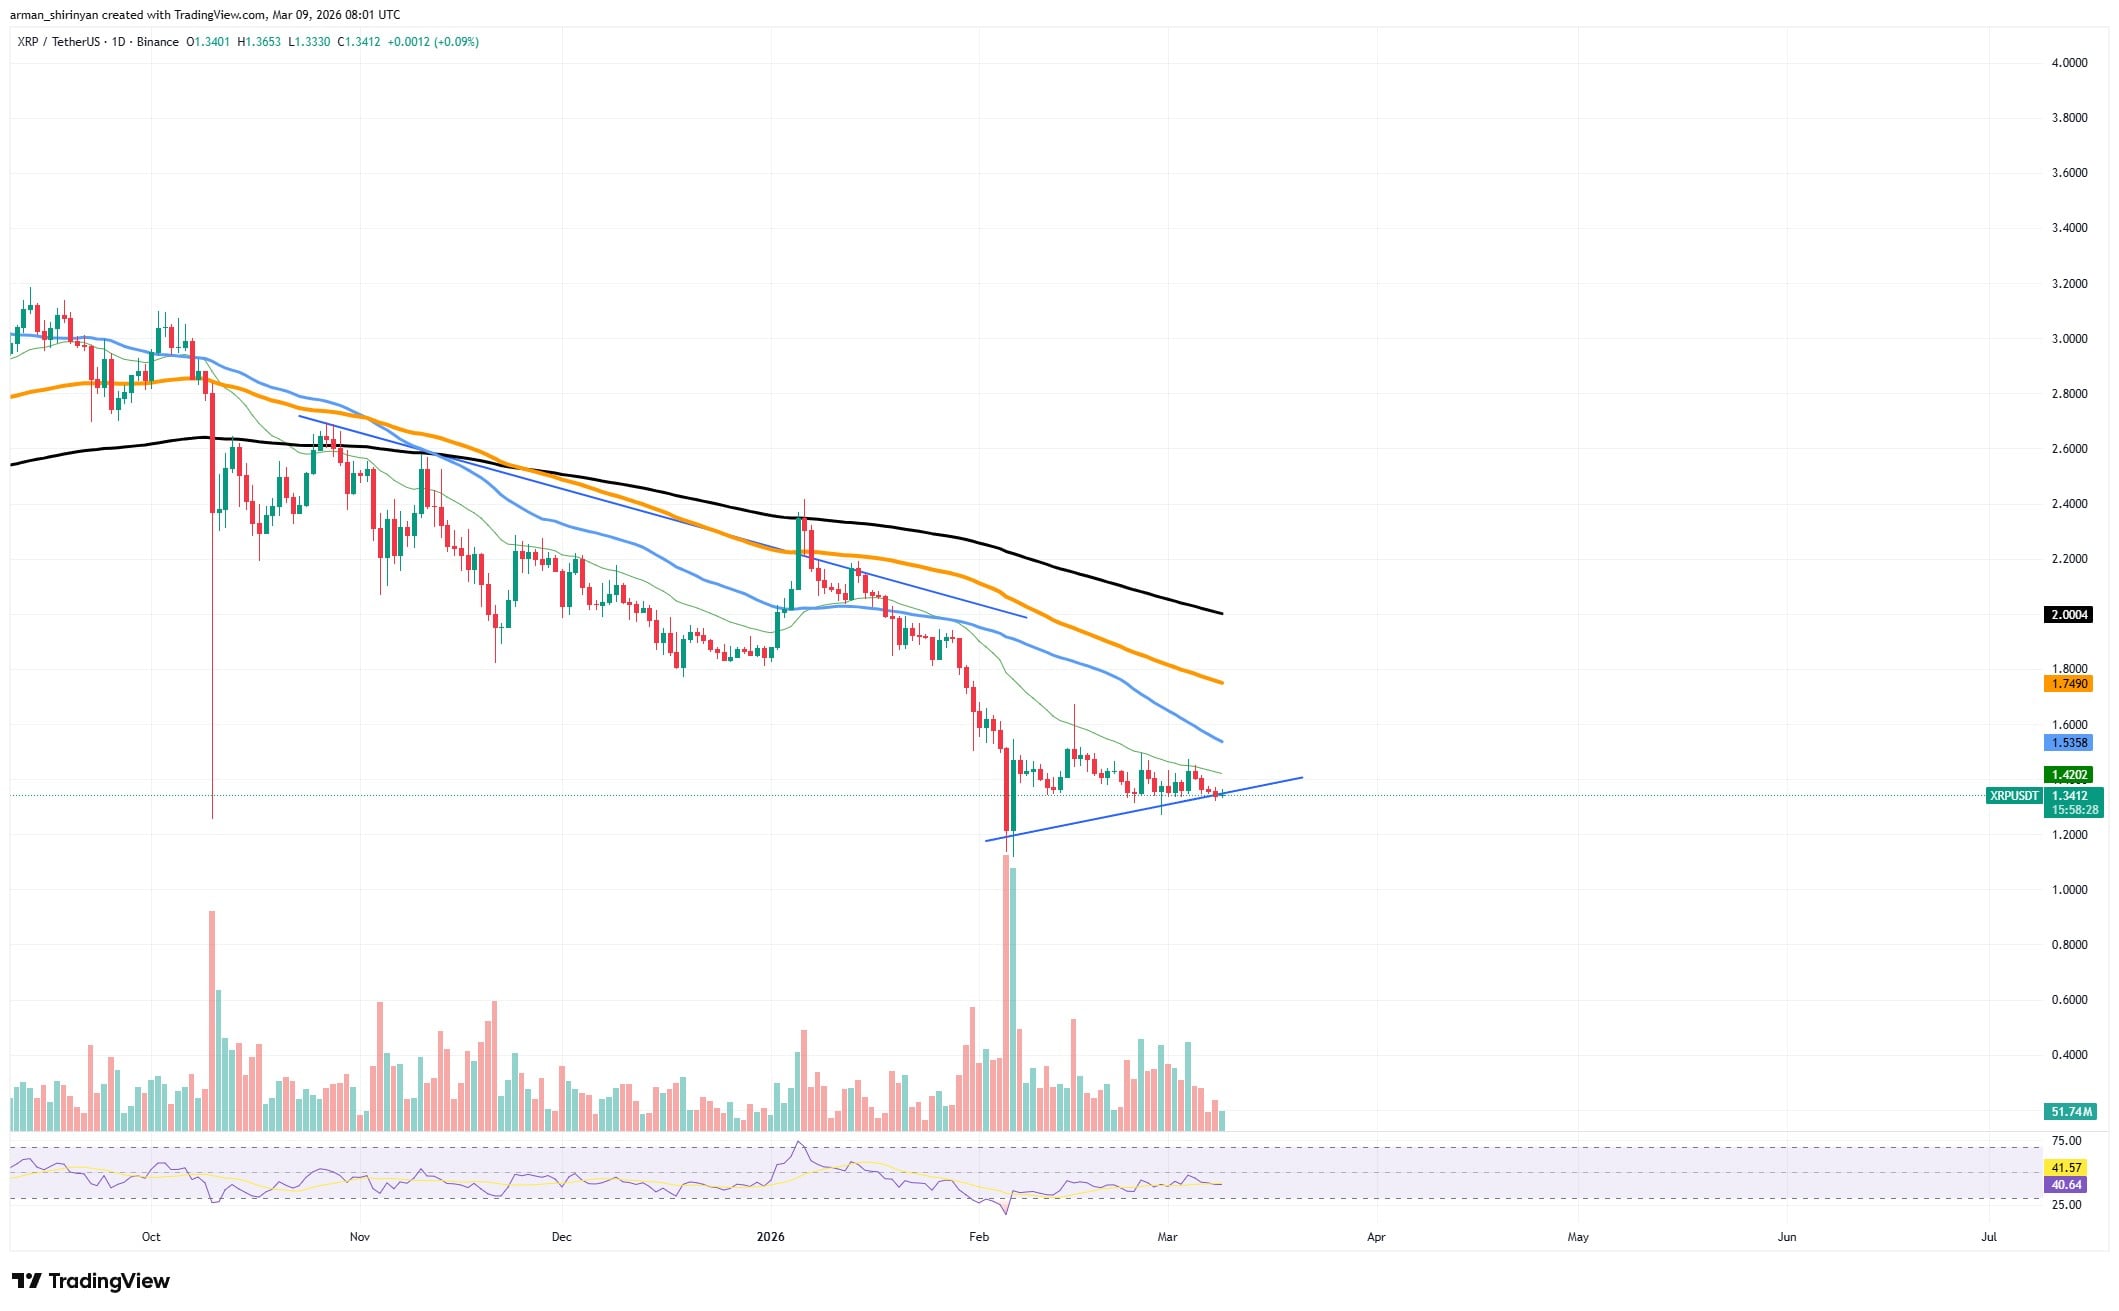
The price behavior near this support line indicates that buyers are gradually absorbing the residual selling pressure, even though the overall trend is still technically bearish.
The main exponential moving averages are starting to compress above the price at the same time. The mid-range EMA cluster is moving downward toward the current trading zone, while the shorter-term averages have already leveled off. This convergence is very important.
First resistance
The first technical barrier is currently located close to the $1.40-$1.42 range, where $XRP is currently interacting with the closest moving average resistance. The next significant cluster, where the larger trend EMAs continue to align, is located between about $1.53 and $1.75.
Above that level, the market structure has moved away from the consistent decline observed since late 2025, if there is a clear move through these levels.
The notion of a base forming is also supported by volume behavior. An obvious exhaustion event was indicated by the huge spike during the February sell-off. Since then, trading activity has stabilized and price volatility has decreased. As liquidity increases within the range, this kind of environment frequently precedes more significant directional shifts.
At this point, the market seems to be moving from a panic-driven decline into a period of stabilization.
The much-needed technical fuel for a more robust $XRP recovery may finally start to develop if the rising support holds and the EMA compression resolves to the upside. The chart currently depicts a market that is quietly getting ready rather than one that is still collapsing.

 u.today