
Dogecoin approaches a key resistance zone as traders monitor momentum signals to determine whether a broader recovery move can unfold.
Dogecoin ($DOGE) trades near $0.0939, recording a 1.91% decline over the past day as the market shows mild selling pressure.
The intraday chart reveals an early surge that briefly pushes the price close to $0.098 before momentum fades and the asset reverses direction. After the spike, $DOGE drifts lower and fluctuates between roughly $0.093 and $0.096, suggesting the market enters a short consolidation phase while traders reassess sentiment.
Performance data across broader time frames reflects continued weakness in the asset’s recent trend. Dogecoin posts a 2.04% drop in the last 24 hours, while the 7-day decline reaches about 3.23%, and the 30-day loss extends to roughly 11.13%. With the price hovering near key support levels, the question now is whether buyers can step in and spark the next move.
Dogecoin Price Analysis
On a daily chart, Dogecoin is continuing to move within a broader downward structure that has developed over the past several weeks. Price is closing in on the middle Bollinger Band near $0.0963, indicating that bearish pressure still influences the trend.
The upper band sits near $0.1036, forming a key resistance level, while the lower band around $0.0889 acts as the nearest support if selling pressure intensifies.
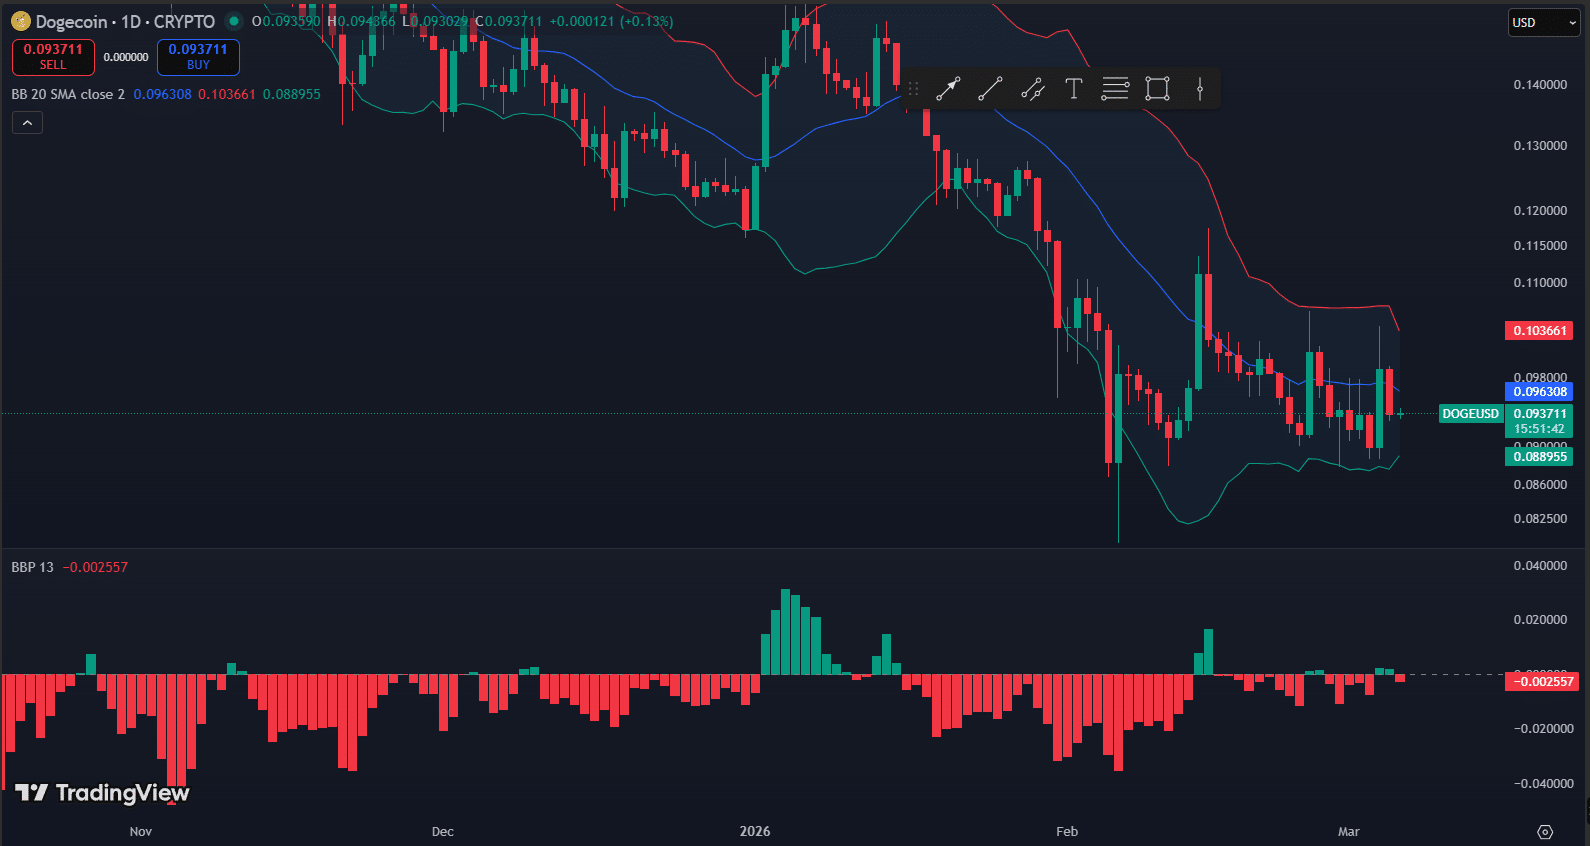
Meanwhile, the Balance of Power indicator remains slightly negative near -0.0025, signaling that sellers maintain a marginal advantage in the market. However, the histogram shows decreasing bearish momentum compared with earlier sessions, suggesting that selling pressure is gradually easing.
If Dogecoin manages to reclaim the middle Bollinger Band around $0.096, the price could attempt a move toward the $0.103 resistance zone, where the upper band currently aligns.
Dogecoin Futures Flows
Recent futures flow data shows mixed but active capital movement in the Dogecoin derivatives market. Over the past 30 minutes, inflows sit at about $22.30 million while outflows stand near $15.50 million, leaving a net inflow of roughly $6.81 million.
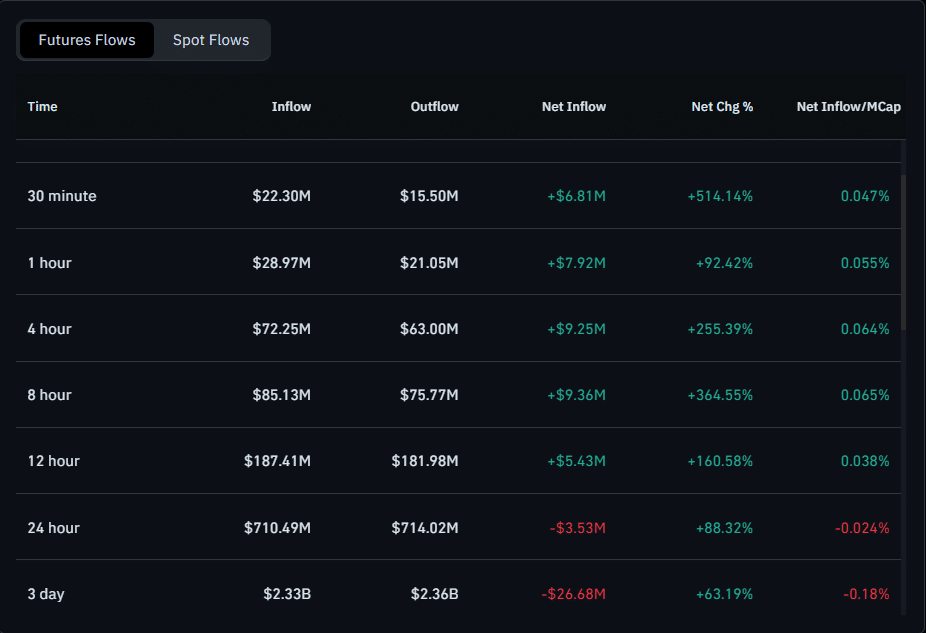
A similar pattern appears in the one-hour window, where inflows total $28.97 million compared with $21.05 million in outflows, resulting in a $7.92 million positive net flow. These short-term figures suggest that traders continue allocating fresh capital into $DOGE futures positions.
However, longer time frames present a more balanced picture. In the 4-hour and 8-hour periods, net inflows remain positive at about $9.25 million and $9.36 million, indicating steady market participation.
Meanwhile, the 24-hour data shows a slight net outflow of $3.53 million, as total inflows of $710.49 million fall just below $714.02 million in outflows. Over the three days, the market records a larger $26.68 million net outflow.