$XRP is approaching a technically important area as recent bullish price action pushes prices close to a major long-term indicator.
Specifically, $XRP is attempting to sustainably close above its 200-week exponential moving average, a level many analysts view as a thin line between continued price weakness and renewed strength. How $XRP handles this crucial level would determine its next near-term price trajectory.
Key Points
- $XRP is attempting to sustainably push above its 200-week exponential moving average.
- The weekly indicator sits at $1.41, slightly below the current market price of $1.42, and a weekly close above it would be crucial for $XRP.
- The $1.55 resistance level is also a notable price level, and a weekly close above could signal improving short-term momentum.
- Even if $XRP briefly climbs above these levels, a broader descending channel still defines the current structure.
- A much stronger bullish reversal signal could appear if the price eventually closes a week above the channel’s upper resistance neckline at the $2.20 region.
$XRP Around Key EMA and Resistance
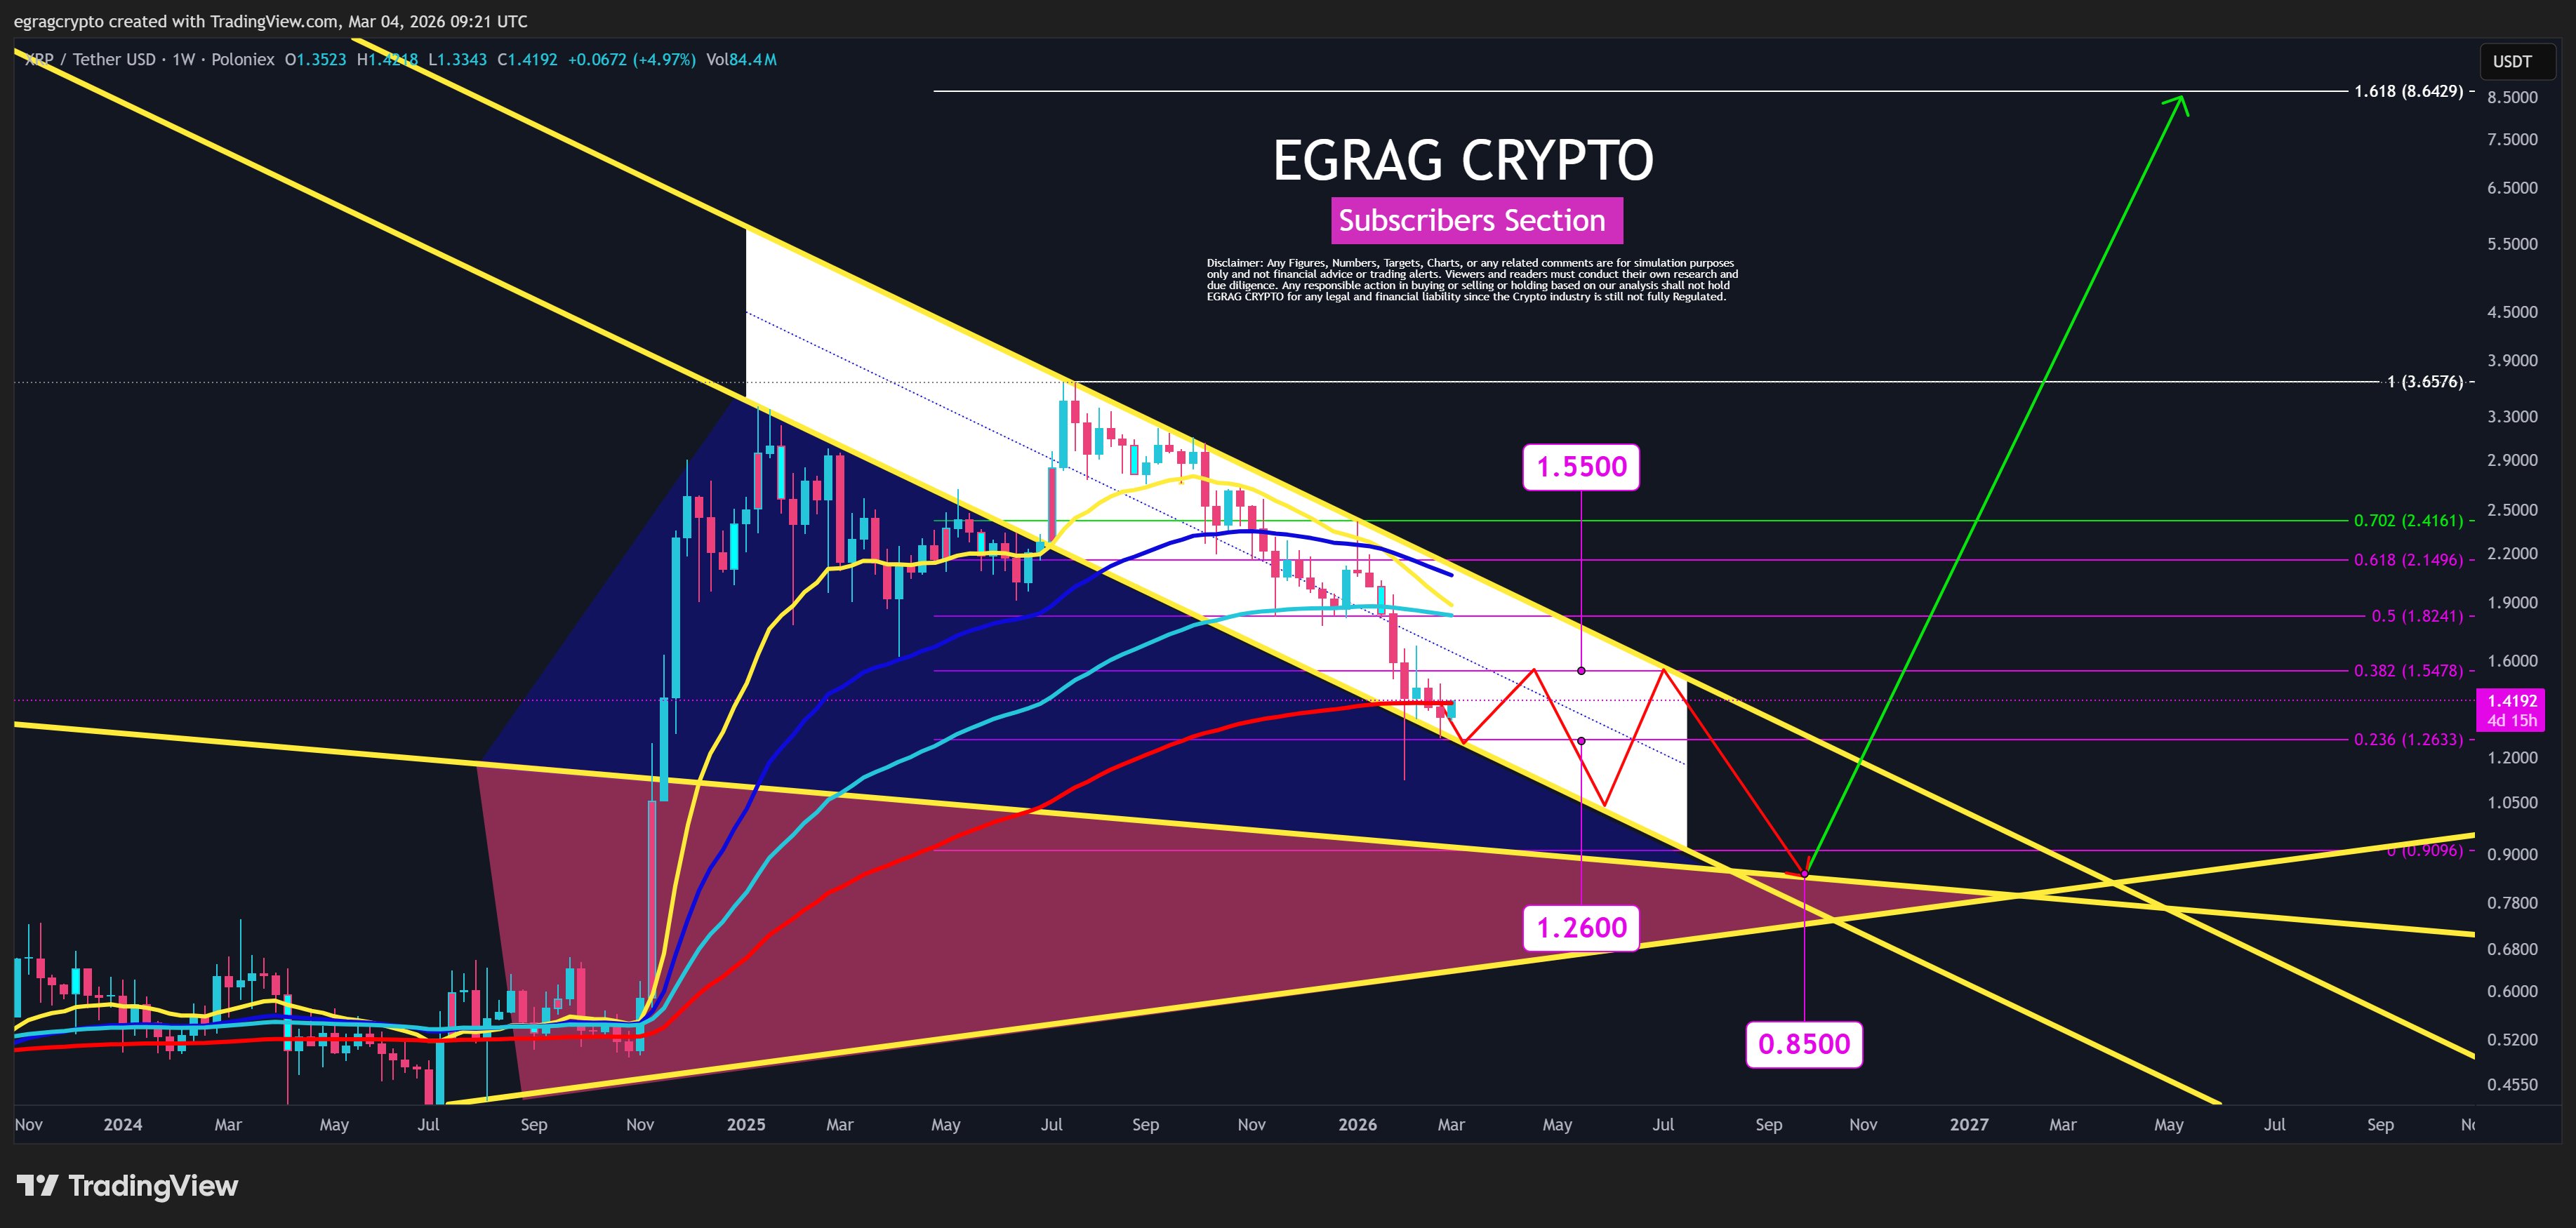
A recent technical analysis from EGRAG Crypto highlights the recent $XRP trend towards the 200-week exponential moving average. The coin is up 5.5% this week, with much of that gain coming from the Wednesday rally. It pushed $XRP to a high of $1.47 before settling near its current market price of $1.42.
According to the analyst, this closely aligns with the 200-week EMA. Market data confirms this. The weekly indicator sits at $1.41, slightly below the current market price. Notably, he stressed the importance of this level, highlighting that a weekly close above it would be crucial for $XRP.
Meanwhile, EGRAG also spotlighted the $1.55 resistance level as a notable price level. It aligns with a crucial resistance level and reaching it would require an over 9% increase from the current market price.
Closing above both points on the weekly timeframe could signal improving short-term momentum. Market sentiment may begin to shift as participants interpret the move as a sign that buyers are regaining control.
Descending Channel Still Poses Downward Risk
However, even if $XRP briefly climbs above these levels, EGRAG notes that a broader descending channel still defines the current structure. As a result, analysts stress that confirmation would require sustained movement beyond the channel to totally decimate corrective momentum.
The descending channel formed after the July 2025 peak of $3.66. Since then, the downward-facing wedge has directed $XRP’s price in a lower-highs, lower-lows trend.
 $XRP Descending Channel/EGRAG Crypto">
A much stronger bullish reversal signal could appear if the price eventually closes a week above the $2.20 region, which aligns with the channel’s upper resistance neckline. Such a move would set $XRP up to break above other major resistance levels, confirming that the corrective phase is losing momentum.
Possible Scenario if $XRP Loses $1.55
If the $1.55 region fails to hold, the analyst suggests the possibility of a deeper pullback. In that case, price could revisit the next support zone at $1.2, representing an 11% correction from here.
$XRP could still retest lower support areas at $0.95 and $0.85. These levels align with previous support zones and trendline intersections on the chart.