Solana advances toward key resistance as rising buying pressure and widespread short liquidations strengthen bullish momentum.
Solana ($SOL) recorded a notable intraday recovery, with the price trading around $89.67 after gaining roughly 5.7% over the past 24 hours. After hovering near the lower range earlier in the day, $SOL accelerated upward and approached the $90 zone.
Market metrics further underline the network’s scale, with Solana’s market cap exceeding $51 billion and 24-hour trading volume surpassing $6 billion, up 2.64% in the past day.
The price structure suggests a clear shift in momentum as buyers pushed the asset toward the upper boundary of the daily range. If upward pressure continues, the Solana price could attempt to breach levels above the $89–$90 region, while any pullback may find short-term support around the $86–$87 range.
Can Solana Breach Key Resistance?
The 4-hour chart for Solana shows the price trading just below $90, signaling renewed bullish momentum after a period of sideways consolidation. Recent candles reveal a steady climb above the midline of the Bollinger Bands, indicating strengthening buying pressure. The price has now breached the upper Bollinger Band at $89.6.
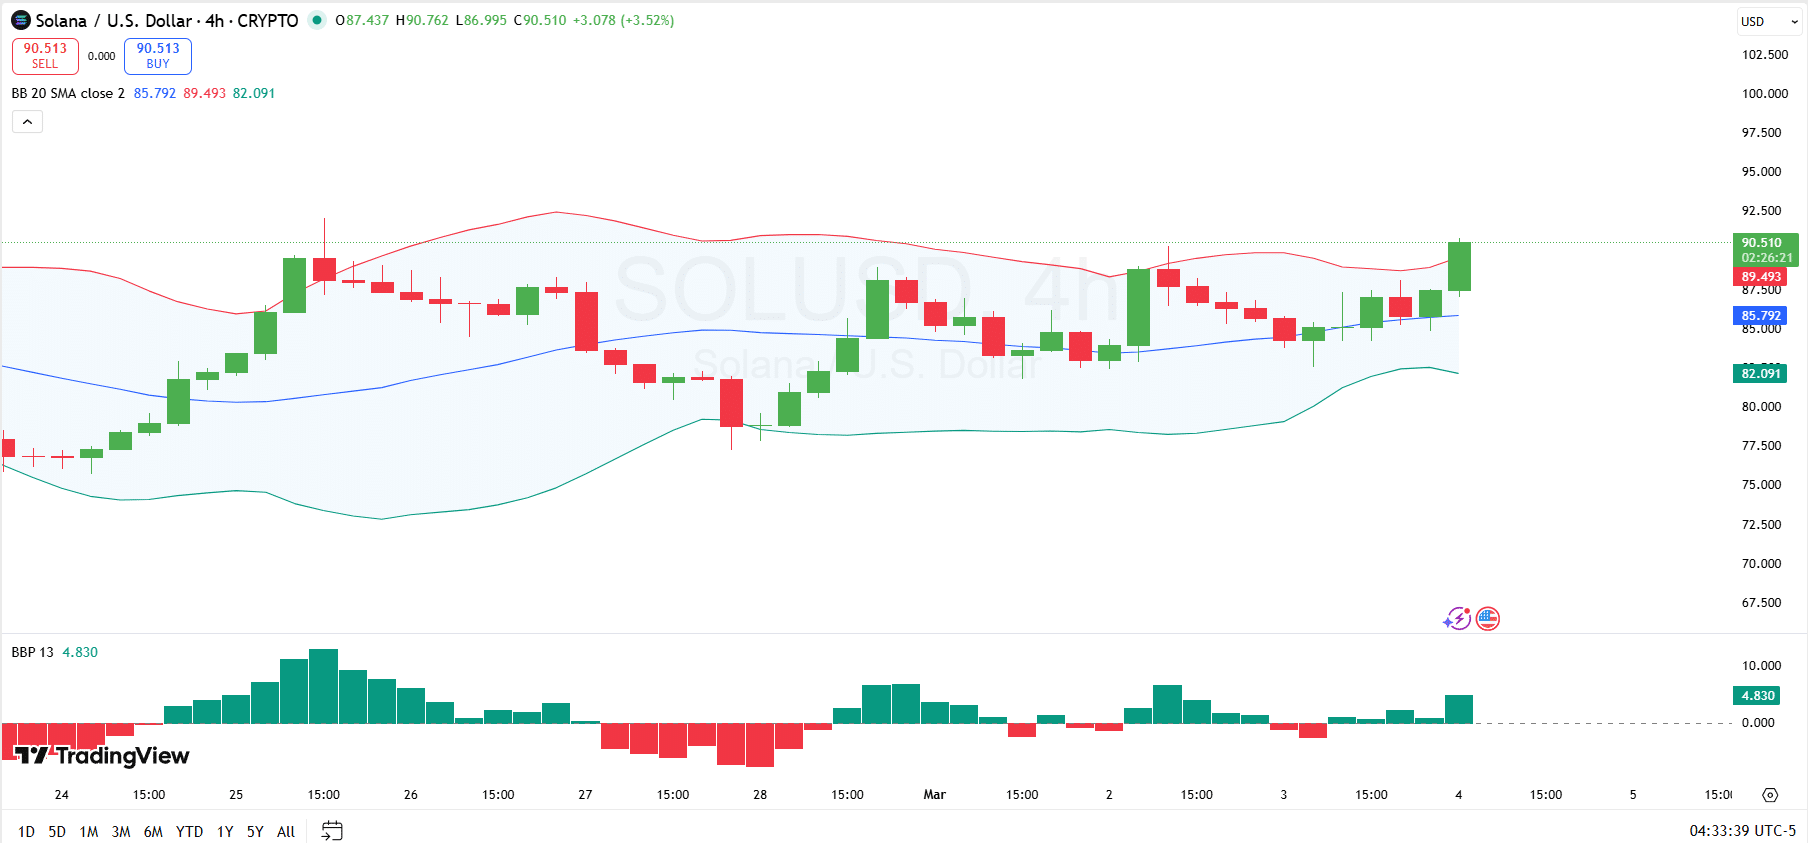
From a technical standpoint, the next resistance sits around $92.02, a zone where the upper band and recent price peaks converge. A sustained break above this level could open the door for a move toward the $95 region, which would mark the next significant resistance area on the chart.
On the downside, initial support appears near $85.8, aligned with the Bollinger Band midline and recent consolidation. A deeper pullback could target the $82 level, where the lower Bollinger Band currently provides a broader support base.
Meanwhile, the Bull Bear Power indicator is currently in positive territory, reading around 4.83, which suggests that buyers are gaining control of the short-term trend. The histogram has shifted from earlier red bars into green territory, indicating that bullish momentum has started to strengthen after a brief consolidation phase.
Solana Liquidation Data
Recent liquidation data for Solana shows that short traders have taken the largest hit as the asset moved higher.
In the past hour alone, roughly $5.11 million in positions faced liquidations, with short positions accounting for about $4.97 million, compared with only $134,970 in long liquidations. The imbalance suggests that the recent upward move triggered a wave of forced short closures as the price pushed through key resistance levels.
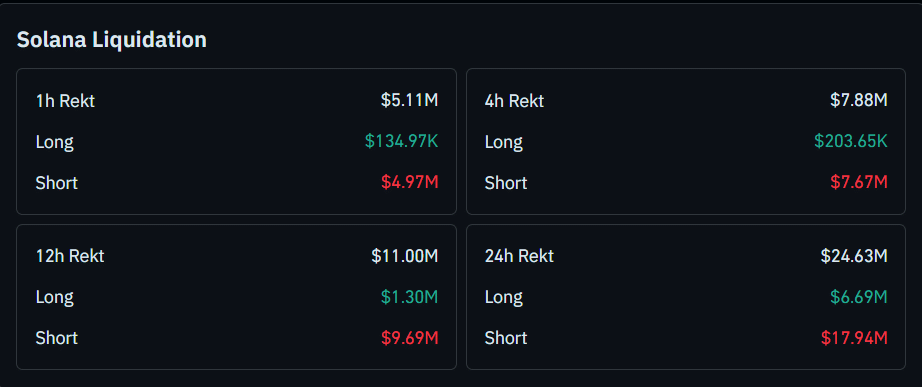
The trend becomes even clearer across longer timeframes. Over the past 24 hours, total liquidations reached about $24.63 million, with shorts contributing nearly $17.94 million, significantly outweighing the $6.69 million in long liquidations.
This pattern indicates that bearish traders were largely caught off guard by the rally, and the cascade of short liquidations likely helped accelerate Solana’s upward.