Solana ($SOL) has been rejected again at a crucial supply wall around $90 again on Tuesday, March, 3, 2026.
The large-cap altcoin, with a fully diluted valuation of about $51.7 billion, dropped 4% in the past 24 hours to trade around $82.97 at press time. Nevertheless, $SOL price has gained 7.82% in the past seven days amid the ongoing Middle East crisis, signaling its market resilience.
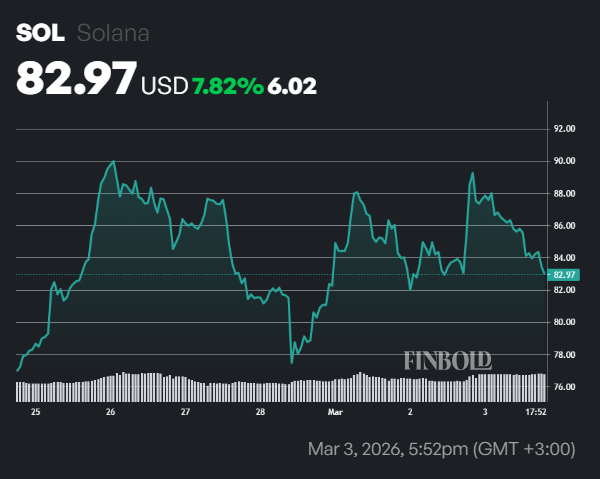
$SOL/USD 7-day chart. Source: Finbold
Solana price trapped in a tight range
In the past four weeks, $SOL price has been trapped in a tight range between $89 and $77. The recent $SOL rejection at the upper border has signaled weak bullish momentum.
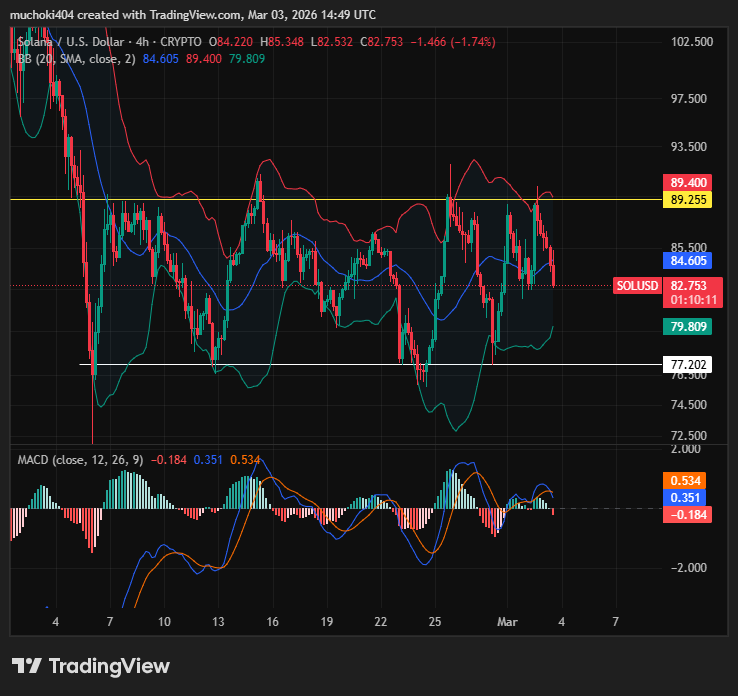
$SOL/USD 4hr chart. Source: TradingView
Furthermore, the $SOL/USD MACD indicator in the 4-hour timeframe has flashed a sell signal. Notably, the MACD line has crossed below the Signal Line amid a bearish histogram. Additionally, $SOL’s 4-hour Bollinger Bands indicator has been squeezing in the last four weeks, signaling an imminent breakout from this range ahead.
What’s next for $SOL amid renewed demand?
Amid the ongoing Solana price consolidation, on-chain data analysis shows a renewed demand from institutional investors. For instance, the assets investment products posted a net cash inflow of about $53.8 million last week, thus increasing their total holdings to $2.159 billion, according to data from CoinShares.
The U.S. spot Solana Exchange-Traded Funds (ETFs) have posted net cash inflows in the past four weeks. On Monday, the U.S. spot $SOL ETFs posted a net cash inflow of about $16.8 million, thus increasing their total funds to around $79.4 million, based on data from CoinGlass.
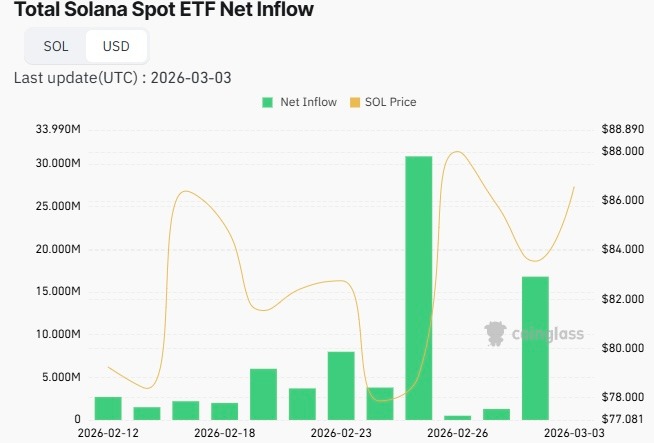
Total $SOL spot ETF net inflow. Source: CoinGlass
Despite the renewed demand for $SOL from institutional investors, crypto analyst Ali Martinez stated that this altcoin has not yet confirmed a clear trendline. As such, this trading expert expects the $SOL price to hit $65 first if it drops below $77 or reach $107 if it rallies above $90 in the near term.