
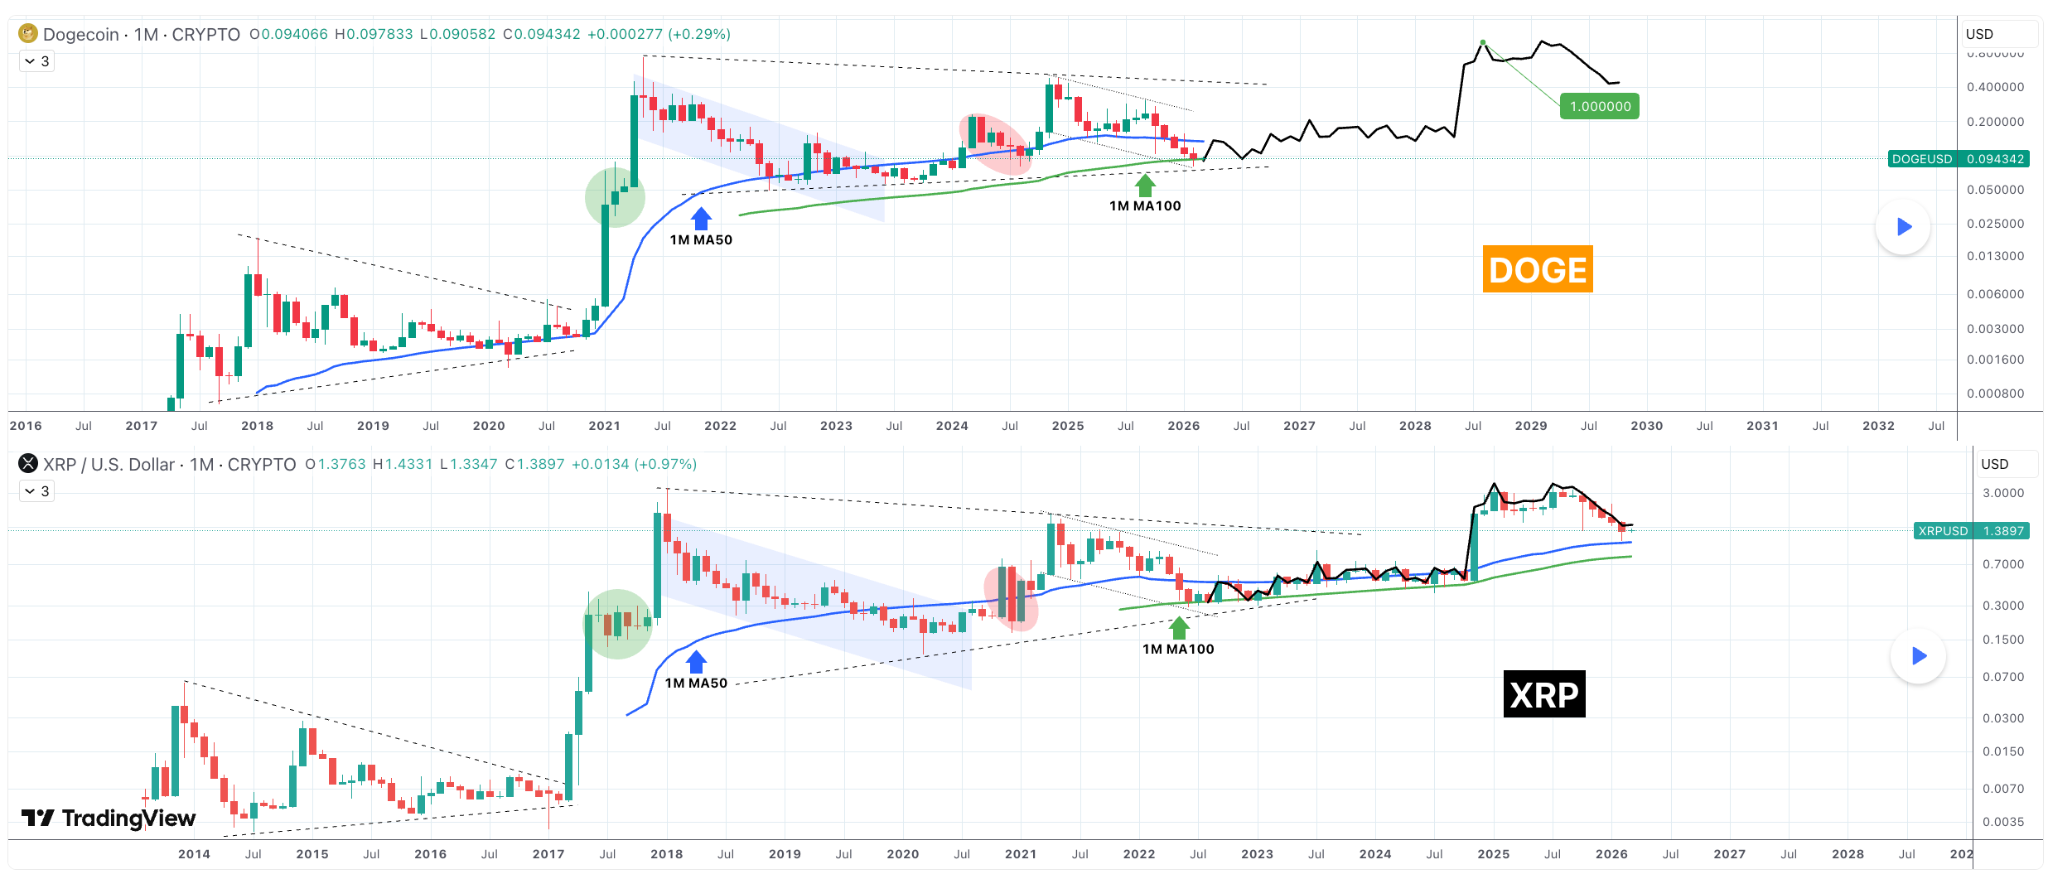
A trading analyst has highlighted a strong cyclical correlation between Dogecoin ($DOGE) and $XRP, pointing to nearly identical multi-year structures that could shape the meme coin’s next major move.
According to TradingShot’s outlook shared in a TradingView post on March 2, if the pattern plays out, Dogecoin could target the coveted $1 level.
The comparison focuses on how both cryptocurrencies behaved after failing to post new all-time highs during their respective bull cycles.
Dogecoin did not break to a fresh peak during the 2023–2024 rally, mirroring $XRP’s failure to set a new high in its 2019–2021 cycle. In both cases, rejection at prior highs was followed by extended corrective phases within large symmetrical triangle formations.
$DOGE’s next big target
On the monthly chart, Dogecoin is trading near its 100-month moving average (MA) and the lower boundary of its long-term triangle, while the 50-month moving average previously acted as dynamic resistance during the decline.
The setup mirrors $XRP’s mid-2022 structure, when it found support at its 1M MA100 and triangle base before consolidating for the rest of the bear cycle.
This suggests Dogecoin could stabilize and move sideways for months if the pattern repeats, with the analyst noting the structures closely align and that $DOGE trails $XRP’s macro price action by about three and a half years.
If that structural symmetry persists and Dogecoin follows the $XRP trajectory, the projection places a move toward $1 in mid to late 2028.
$DOGE price analysis
By press time, Dogecoin was trading at $0.090, showing consolidation over the past week, with the daily and weekly timeframes down about 1%.
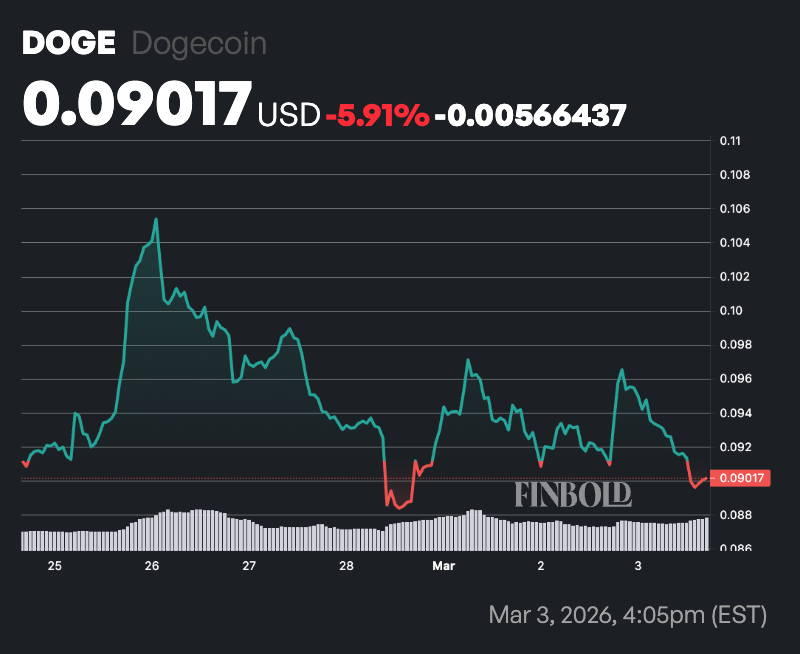
The cryptocurrency remains below its 50-day simple moving average of $0.1109 and its 200-day SMA of $0.1600. Holding below these key trend indicators signals sustained downside pressure, as the shorter-term average remains beneath the longer-term average, reinforcing a broader bearish structure.
Meanwhile, the 14-day RSI stands at 42.72, placing it in neutral territory but leaning toward the lower end of the range.
This suggests momentum is subdued rather than oversold, indicating that while selling pressure has been notable, the asset has not yet reached exhaustion levels.
Featured image from Shutterstock