
Shiba Inu is showing a bullish reversal after earlier weakness. Price dropped from around $0.00000566 to near $0.00000545, reflecting sustained selling pressure. Recovery attempts struggled below $0.000565. A sharp rally then lifted the token above $0.00000570, touching about $0.00000575 before a minor pullback to around $0.000005712. Momentum has turned positive in the short term. Resistance sits near $0.00000575, while support is building around $0.00000565.
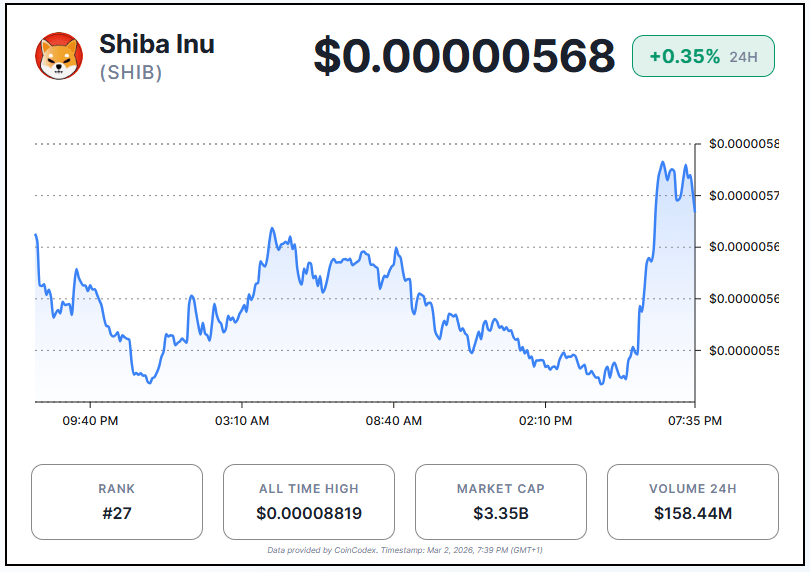
Currently, $SHIB is trading at $0.00000568, up 0.35% over the past 24 hours. Meanwhile, the token’s market capitalization stands at approximately $3.38 billion, ranking it 27th among global cryptocurrencies.
$SHIB Breakdown Risk as $0.00000138 Target Comes Into Focus
According to Ali Martinez, $SHIB’s weekly chart is flashing a critical signal as price compresses near a major support breakdown zone. The token has steadily printed lower highs and lower lows since its 2024 peak, confirming a sustained bearish structure. The $0.0000067 level, which previously served as a strong demand floor, has become fragile after multiple tests. Each rebound has been weaker than the last, indicating buyer exhaustion.
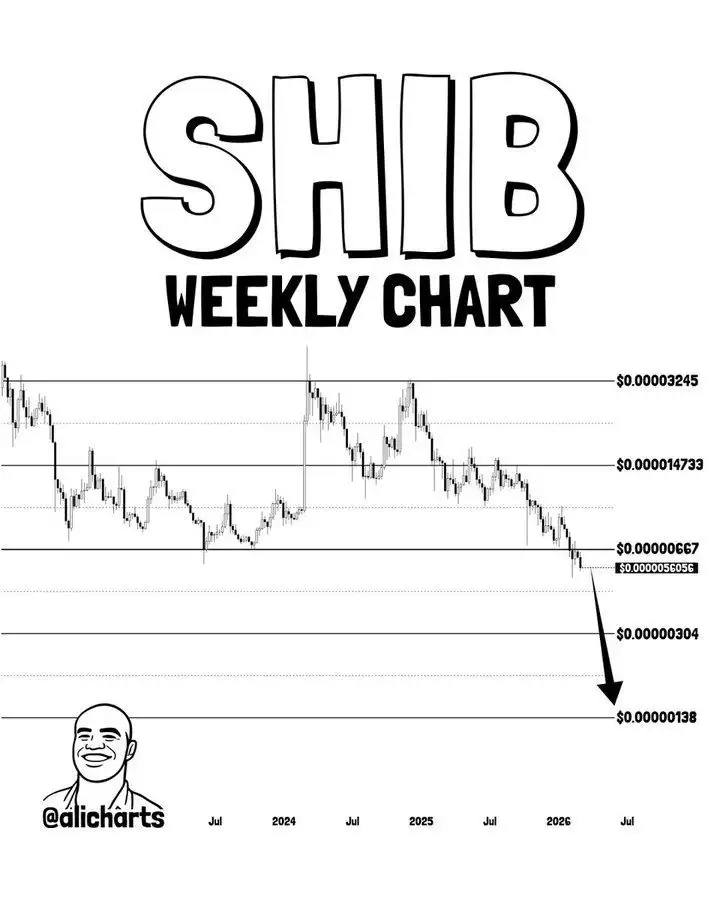
Volume has also tapered during rallies, suggesting a lack of conviction behind upside attempts. From a structural standpoint, the chart reflects distribution rather than accumulation. Momentum indicators on the weekly timeframe continue to slope downward, reinforcing the broader downtrend. This setup, as Martinez highlights, places $SHIB at a pivotal inflection point.
If price fails to reclaim lost support and secure a strong weekly close above resistance, downside acceleration becomes increasingly likely. The chart outlines a clear air pocket beneath current levels, with limited historical support until around $0.00000138. That region represents a prior consolidation base and long-term demand zone. A breakdown toward that target would imply a significant expansion of bearish volatility.
Shiba Inu Price Slides to $0.00000568 as Bearish Momentum Persists
Shiba Inu is in a clear downtrend on the daily chart. From around $0.0000075, it has fallen to around $0.00000568. Price has been making lower highs and lower lows for months. Recent candles show weak recovery attempts that fail at prior resistance levels. Sellers still control the broader structure. The latest bounce off support near $0.0000054 is small and remains below key previous highs.
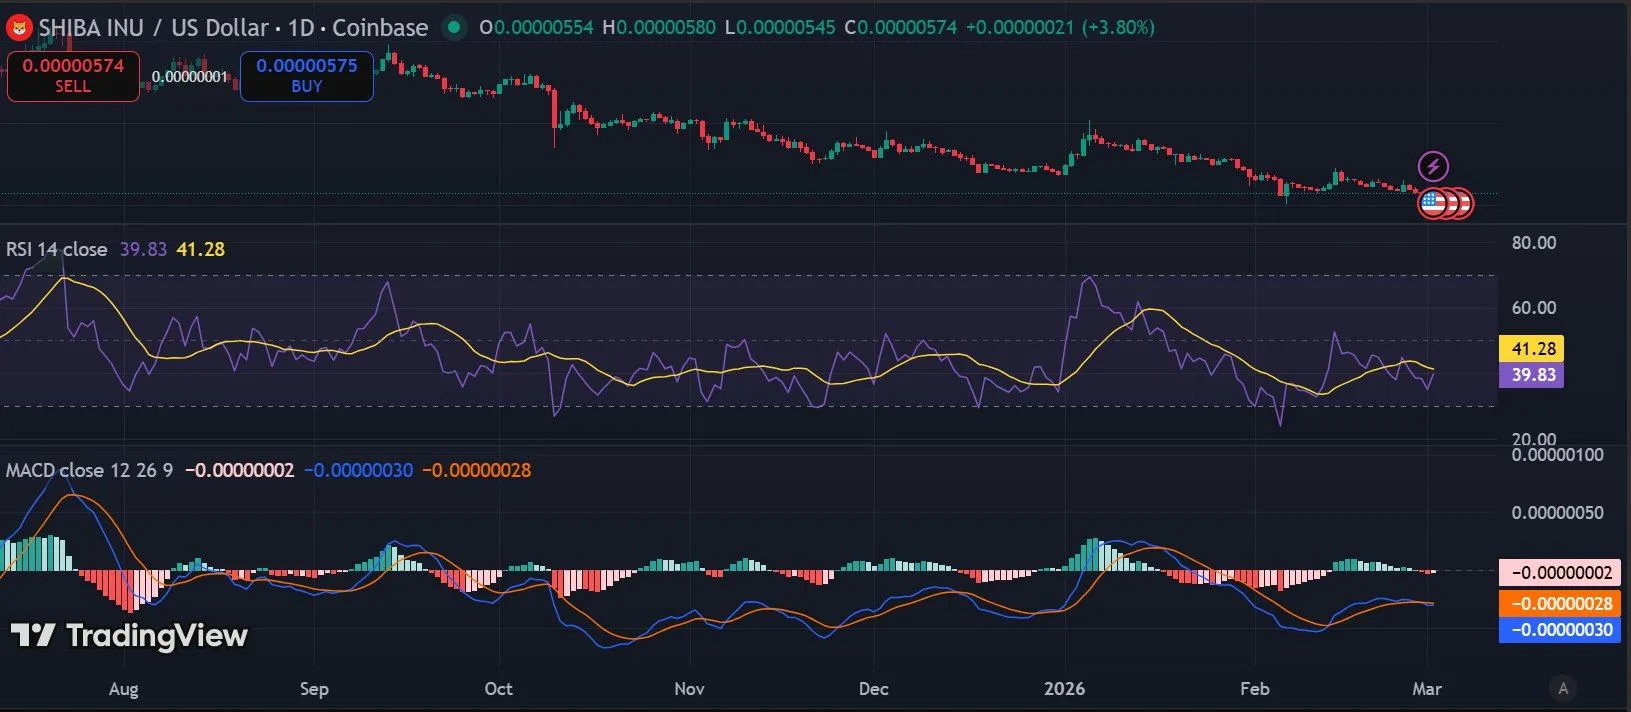
The RSI is near 39.8, showing weak bullish strength and lingering bearish pressure. It isn’t deeply oversold but remains weaker than bullish territory. The MACD line sits below the signal line with values around –0.00000030 vs –0.00000028, and the histogram is slightly negative. This suggests low upside momentum and a continued bearish bias, even as selling pressure eases slightly.