The $XRP Ledger, however, is presenting a completely different picture. According to recent data, there has been a noticeable increase in successful transactions, with activity rising by about 200,000 transactions in a short amount of time. This type of spike indicates increasing network throughput and usage, indicating that actual on-chain activity is picking up speed, even though market sentiment is still generally negative.
Consolidating lower
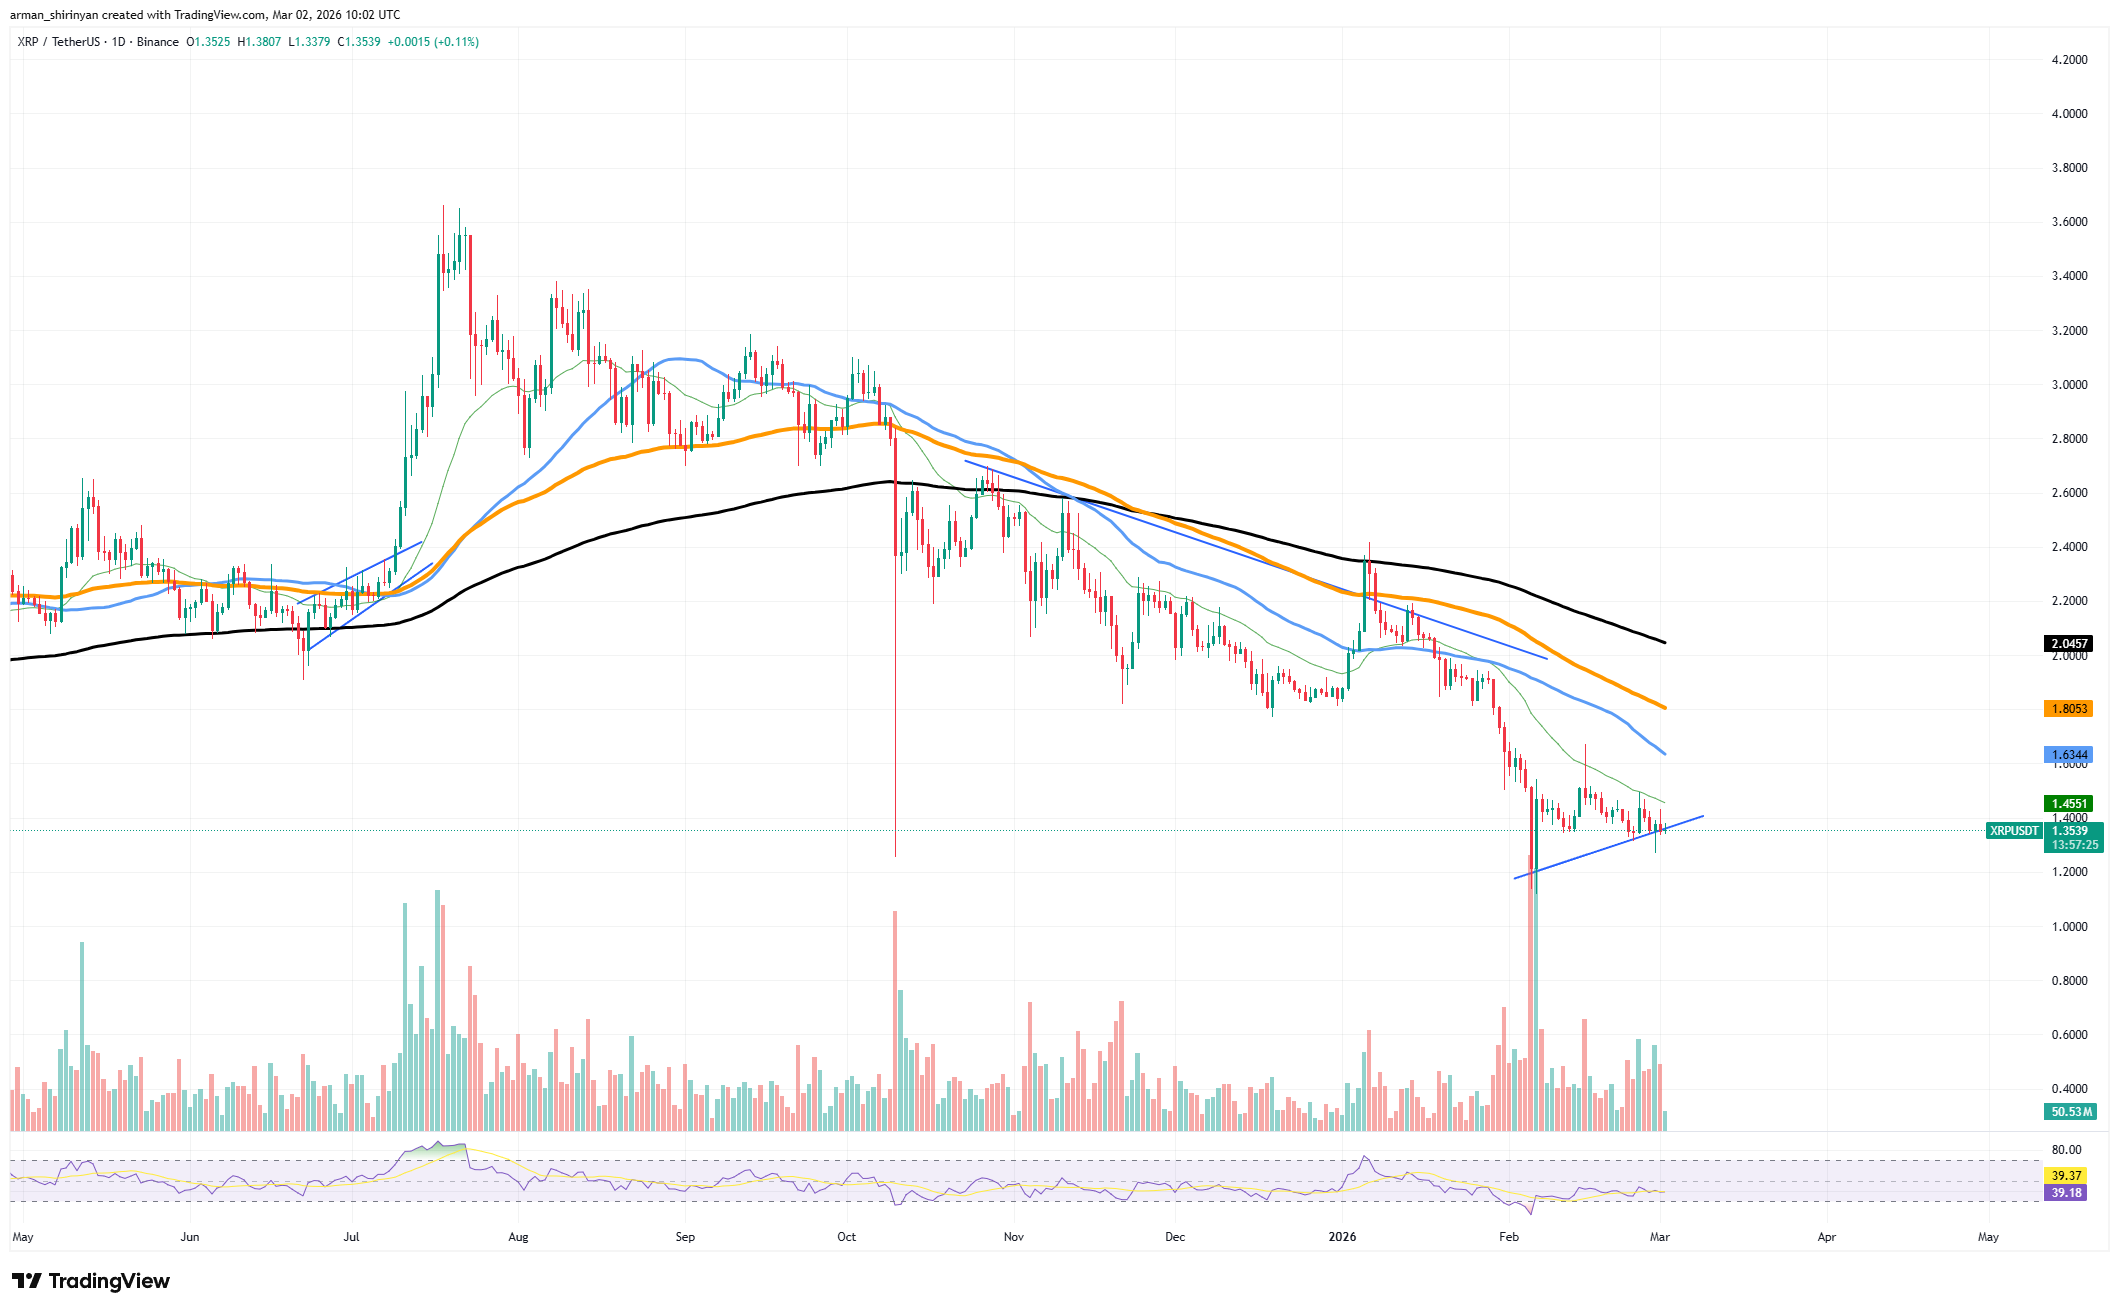
From a technical perspective, the $XRP chart indicates consolidation close to local lows, with volatility compressing following a plunge. This frequently means that the market is awaiting guidance. However, traders remain cautious, and the overall bearish structure remains dominant due to the inability to push sharply higher.
Strong resistance barriers, in the form of moving averages above, restrict attempts at upside and reinforce the notion that a complete recovery is not yet certain.
When the two stories are compared, the tension surrounding $XRP is revealed. The price performance indicates uncertainty and a lack of aggressive buying pressure, whereas on-chain metrics indicate a robust ecosystem and consistent transaction flow.
This discrepancy is significant because, during risk-off periods, markets may ignore network fundamentals for extended periods of time, but they can also occasionally lag behind them. Whether the increase in transaction activity turns into actual buying demand will determine what happens next.

 u.today