
Terra Luna Classic ($LUNC) price lacked clear direction for weeks before staging a sharp three-day rally. The sudden surge pushed the token up nearly 30% at its intraday peak. However, technical and on-chain signals suggest the breakout may struggle to sustain momentum.
The broader crypto market has experienced periodic bursts of volatility. $LUNC’s recent move stands out due to its speed rather than structural strength. While price action turned briefly bullish, underlying metrics indicate caution is warranted.
Bitcoin – The Cause Of $LUNC’s Rise
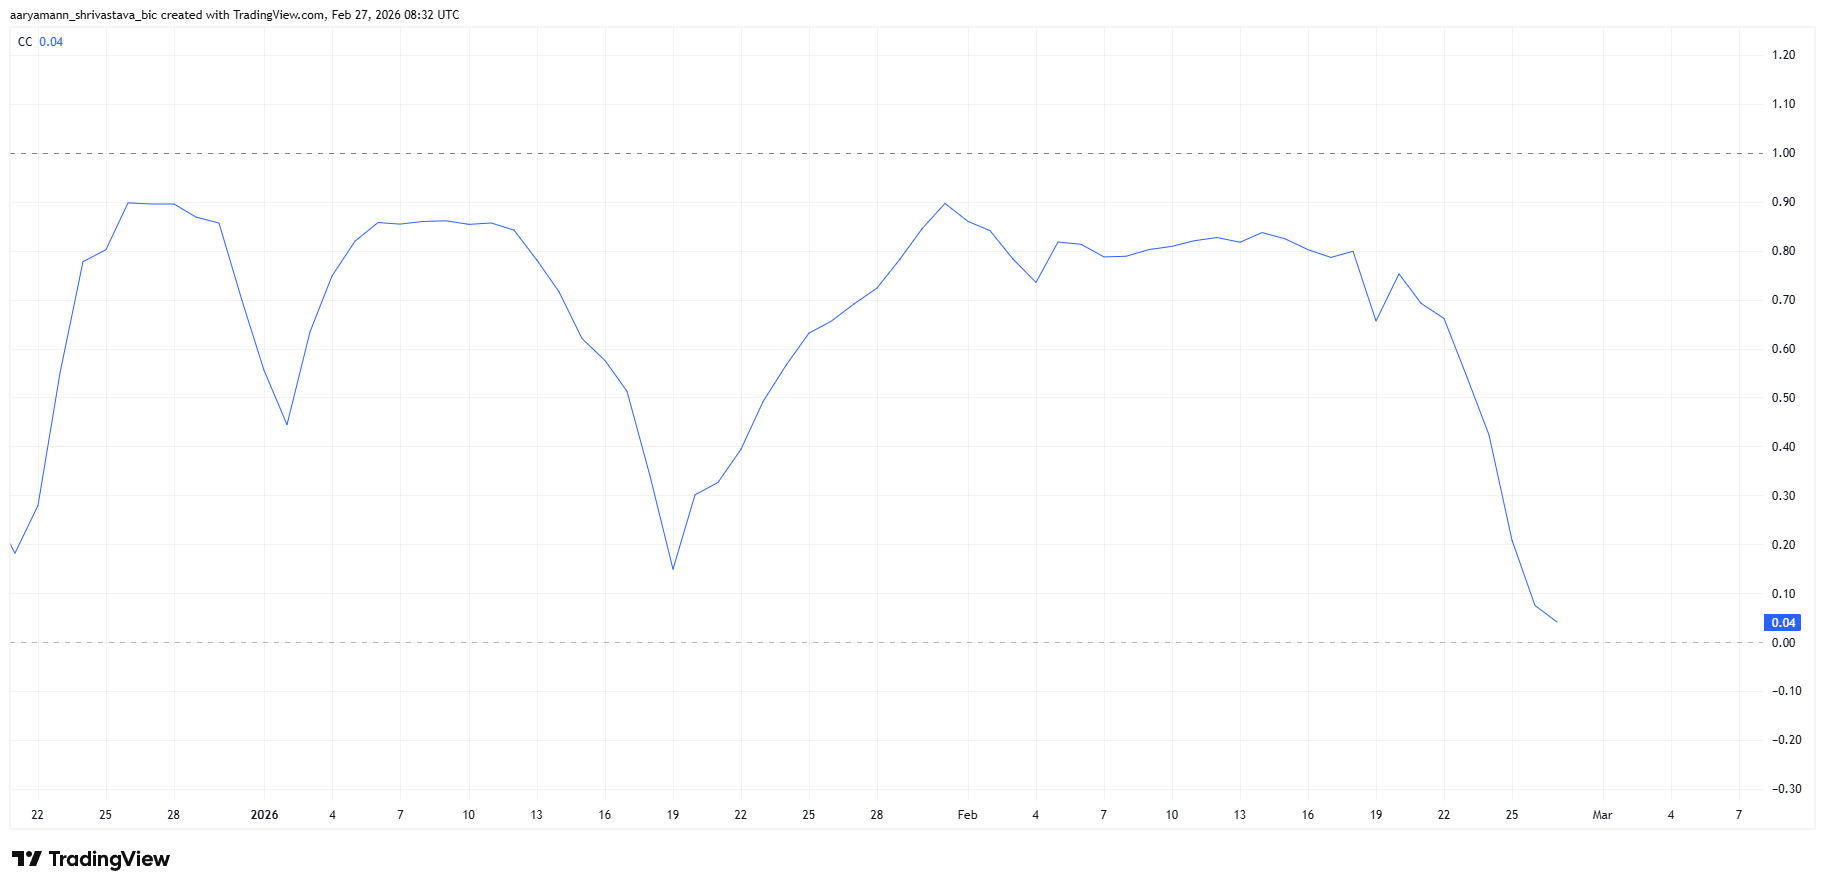
The primary catalyst behind $LUNC’s rally was a surge in trading volume. Increased speculative activity drove short-term price acceleration. At the same time, $LUNC’s correlation with Bitcoin dropped to 0.04, signaling near-complete decoupling.
Such low correlation suggests the token temporarily moved independently of BTC. Decoupling phases can attract traders seeking isolated momentum plays. However, similar patterns have appeared across several altcoins recently. These shifts often reflect short-lived speculative rotations rather than lasting structural change.
Want more token insights like this? Sign up for Editor Harsh Notariya’s Daily Crypto Newsletter here.
 $LUNC Correlation With Bitcoin">
$LUNC Is Trapped Under Bearish Pressure
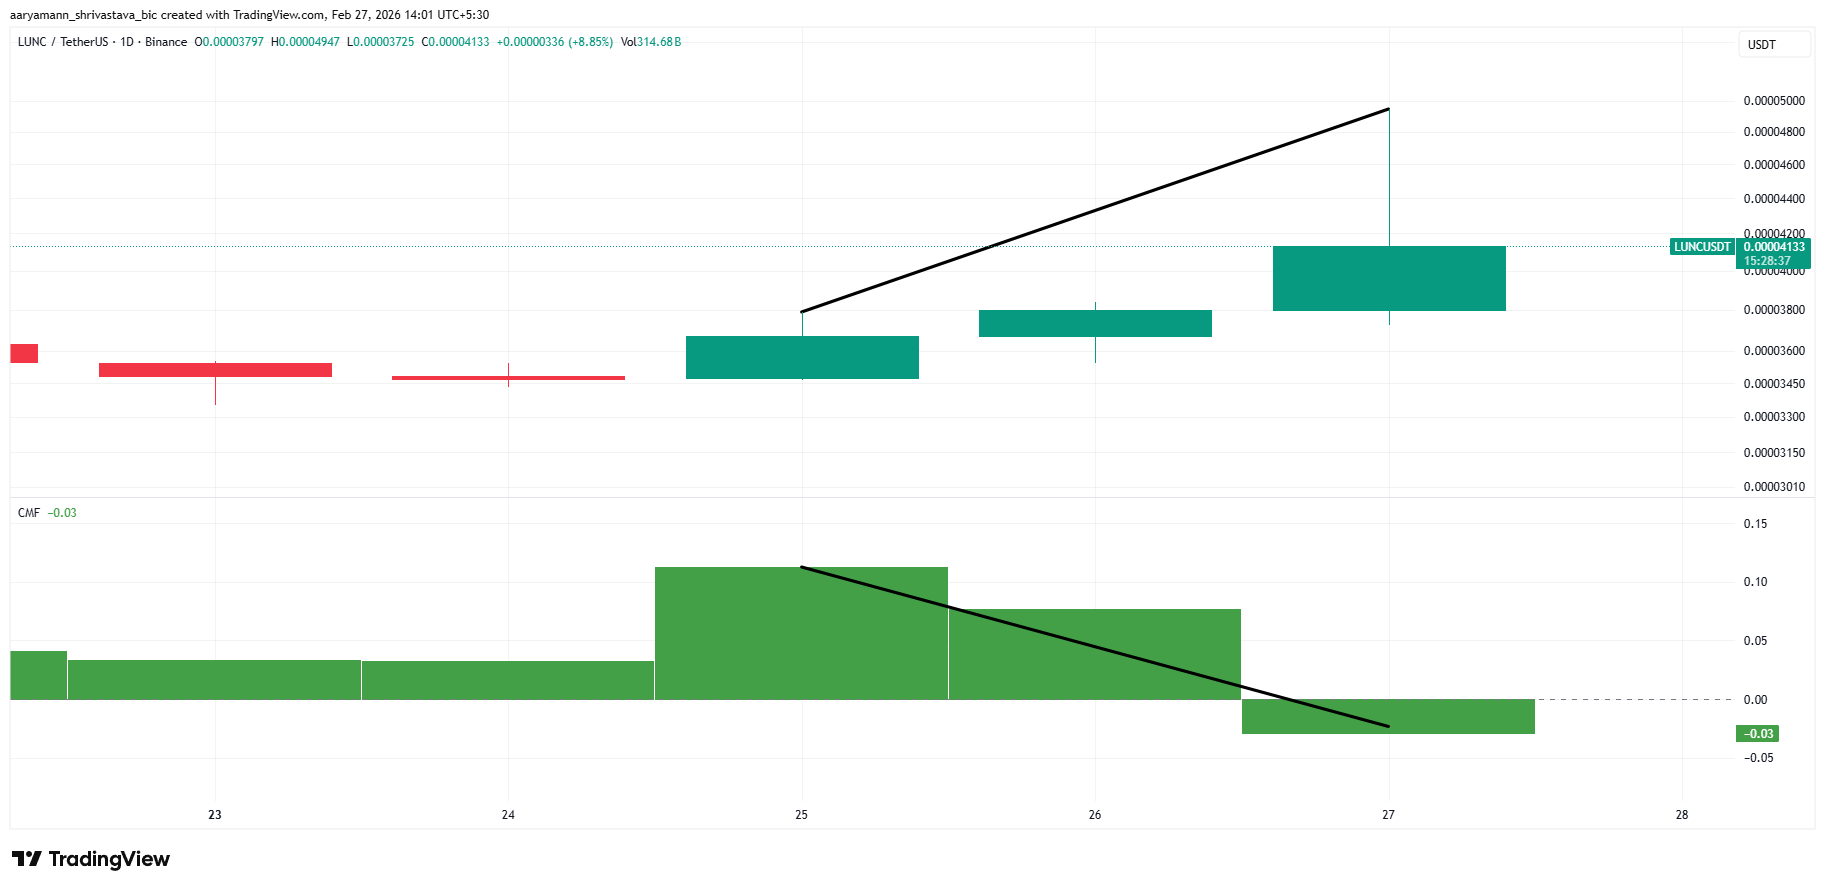
The Chaikin Money Flow indicator reveals a concerning divergence. Despite rising prices over the past three days, CMF did not confirm sustained inflows. Capital entering the market remained subdued relative to price movement.
A bearish divergence formed as price climbed while CMF weakened. This pattern indicates that buying pressure failed to match the rally’s strength. Outflows continued quietly beneath the surface.
 $LUNC CMF">
Weak inflow confirmation raises questions about durability. Without consistent capital accumulation, rallies risk reversal. Price movements unsupported by strong liquidity often correct once speculative interest fades.
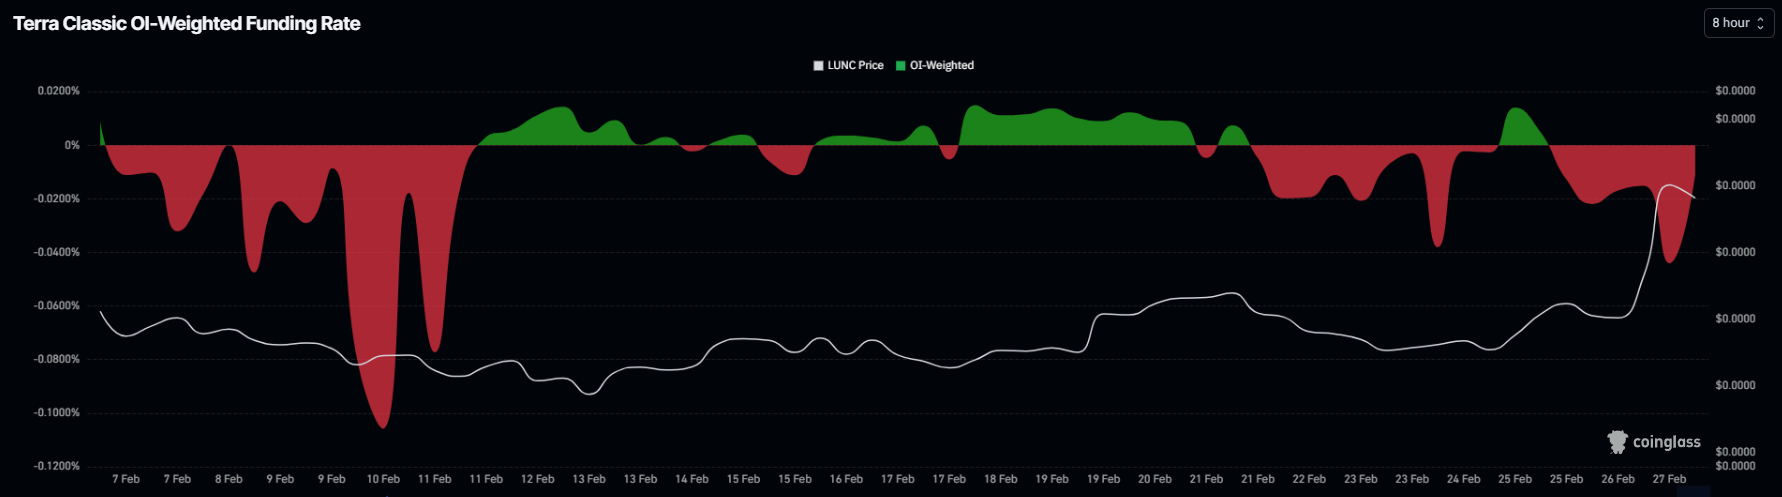
Derivatives data adds to the cautious outlook. $LUNC’s funding rate currently sits in negative territory. Negative funding signals dominance of short positions over longs.
Aggregate funding metrics show traders are positioning for downside risk. Elevated short interest can cap upward momentum. If short bias persists, $LUNC may continue consolidating unless forced liquidations trigger a squeeze.
 $LUNC Funding Rate. ">
$LUNC Price May Not See Much Growth
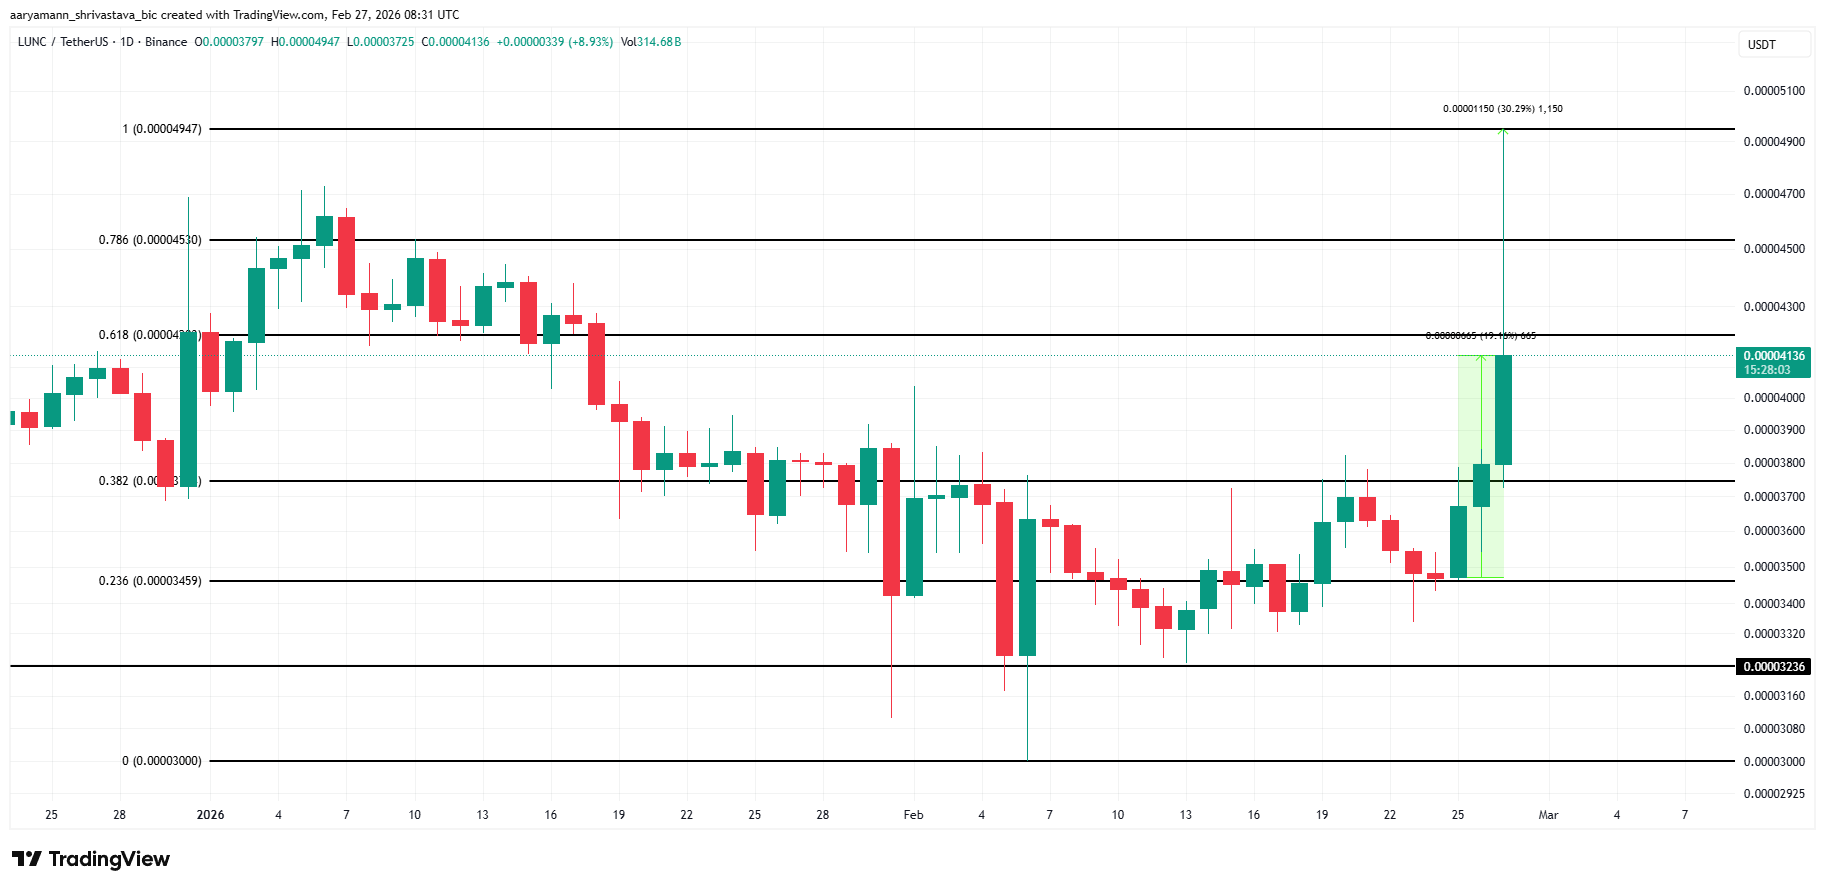
$LUNC rose roughly 20% over the past three days and surged 30% at its recent intraday high before retreating to $0.00004136. The long upper wick on the chart signals rapid profit-taking. Quick distribution at higher levels limited further upside continuation.
Current technical conditions present a bearish bias. If selling pressure resumes, $LUNC could decline toward $0.00003459. This level aligns with the 23.6% Fibonacci retracement. A breakdown below $0.00003459 may expose the next support near $0.00003236, invalidating the bullish recovery narrative.
 $LUNC Price Analysis. ">
On the upside, $LUNC remains capped beneath the $0.00004203 resistance, marked by the 61.8% Fibonacci level. A decisive breakout above this barrier would shift short-term momentum. Flipping $0.00004203 into support could push the token toward $0.00004530 and potentially higher, invalidating the immediate bearish thesis.
The post Terra Luna Classic ($LUNC) Price Soared 30%: Why a Reversal May Follow appeared first on BeInCrypto.