
Both market and on-chain metrics indicate a weakening recovery structure, and Cardano's recent market behavior reveals a dramatic loss of momentum. The most obvious indicator is found in trading activity: the data provided indicates that spot volume on major exchanges has decreased by approximately 45% to 55%, indicating a sharp drop in participation during what had appeared to be an early stabilization phase.
Cardano remains in downtrend
From the standpoint of price structure, ADA is still stuck in a protracted downward trend. The assets trading below the 26 EMA, 50 EMA and 200 EMA on the daily chart confirm the bearish alignment of short-, medium- and long-term trend indicators. The recent price action around $0.29 lacks strong expansion candles and follow-through volume, indicating that buyers are not committing in sufficient size.
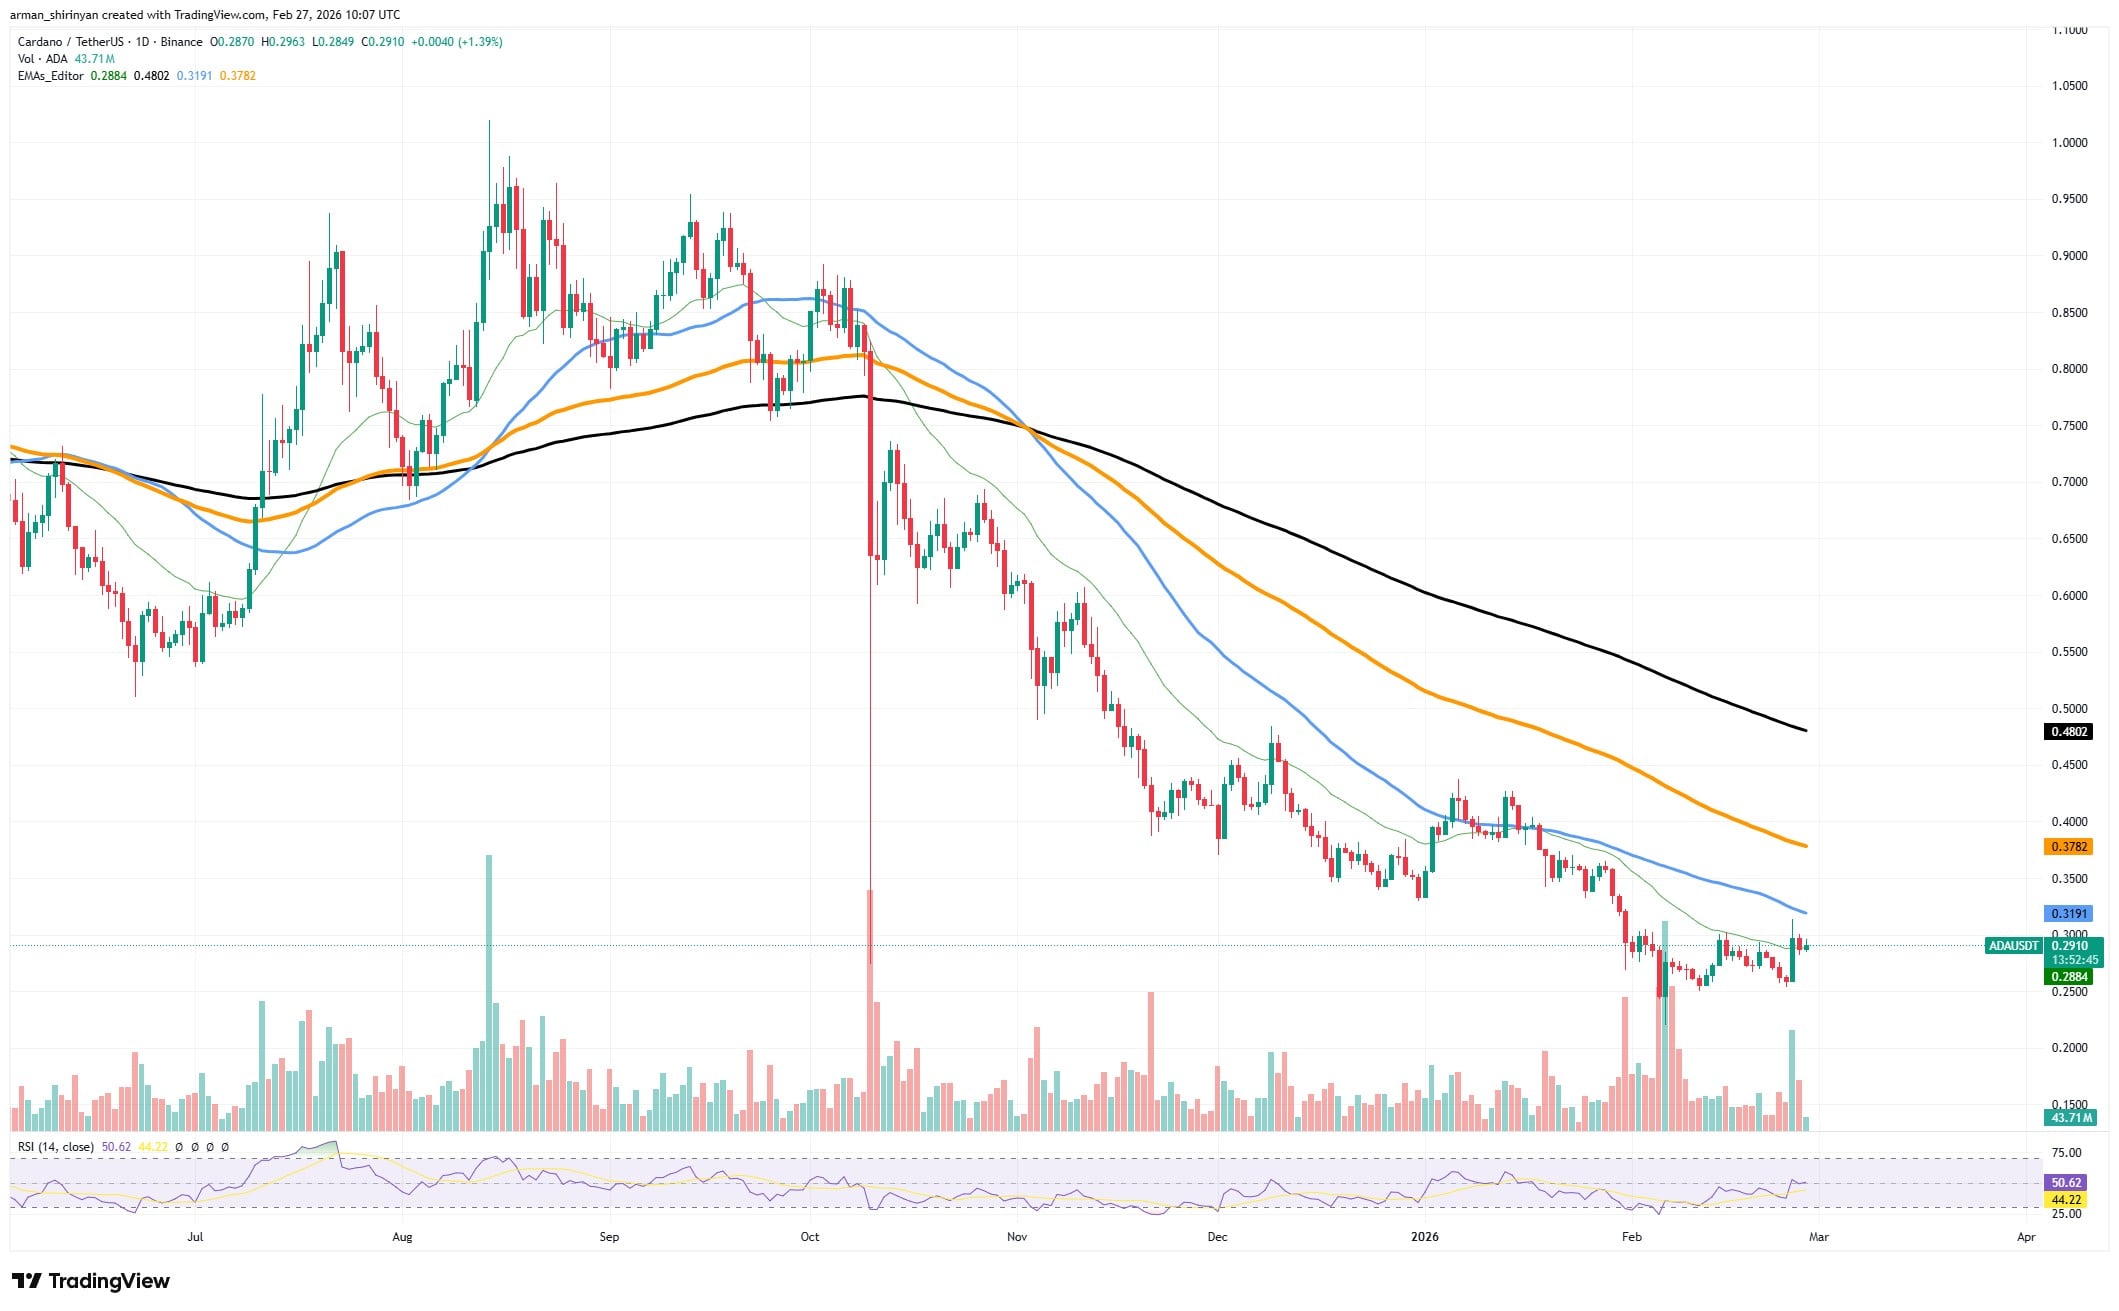
Attempts to regain higher moving averages have also failed time and time again. Considering that earlier recovery efforts depended on short bursts of participation, the volume decline is especially significant. Price rebounds often fade quickly in the absence of sustained liquidity. This dynamic is confirmed by the chart's volume bars, which show isolated spikes followed by decreased activity, indicating fatigue rather than accumulation.
Longs exposure
Data on derivatives add an additional layer. Exchange-wide long/short ratios continue to favor long exposure, but liquidations are still comparatively low. This shows that there is leverage, but it is not causing a breakout. While the four-hour and larger windows show negative net flows, futures flows highlight fragmented sentiment rather than coordinated positioning.
The lack of cohesiveness is reinforced by spot flow metrics. Larger time frame readings shift negatively, suggesting that transient buying interest is not sustained even though short-interval inflows occasionally turn positive.
Additionally, exchange volume heatmaps show that overall participation is decreasing rather than increasing, with concentrated activity on a small number of venues. Market capitalization and on-chain metrics are still comparatively stable, but this stability does not equate to strength.
Rather, it represents stagnation: capital is neither expanding nor leaving the market aggressively. The steep decline in trading volume indicates that instead of actively influencing price direction, participants are simply waiting.