Cardano shows early reversal signals as SAR flips bullish and funding turns positive, pointing to rising upside momentum.
Cardano ($ADA) is currently trading at $0.2926, down 0.4% over the past 24 hours, as price action continues to consolidate within a narrow intraday band. Despite the short-term pause, broader momentum remains mixed.
$ADA has gained 7.4% over the past week and 12.6% over the past 14 days, signaling improving near-term sentiment. However, the asset is still down 18.0% over the last 30 days, indicating that the wider corrective trend has not fully reversed.
From a market fundamentals standpoint, Cardano maintains a market cap of approximately $10.77 billion, supported by $606.38 million in 24-hour trading volume. This level of activity suggests steady liquidity as traders assess whether $ADA can maintain higher lows and generate sustained momentum above the $0.29 region.
Cardano Price Analysis
Looking elsewhere, Cardano is showing early signs of a potential trend shift as the Parabolic SAR dots have flipped below the price, with the current SAR level near $0.2549. This transition typically signals that bearish momentum has weakened and that buyers may be regaining short-term control.
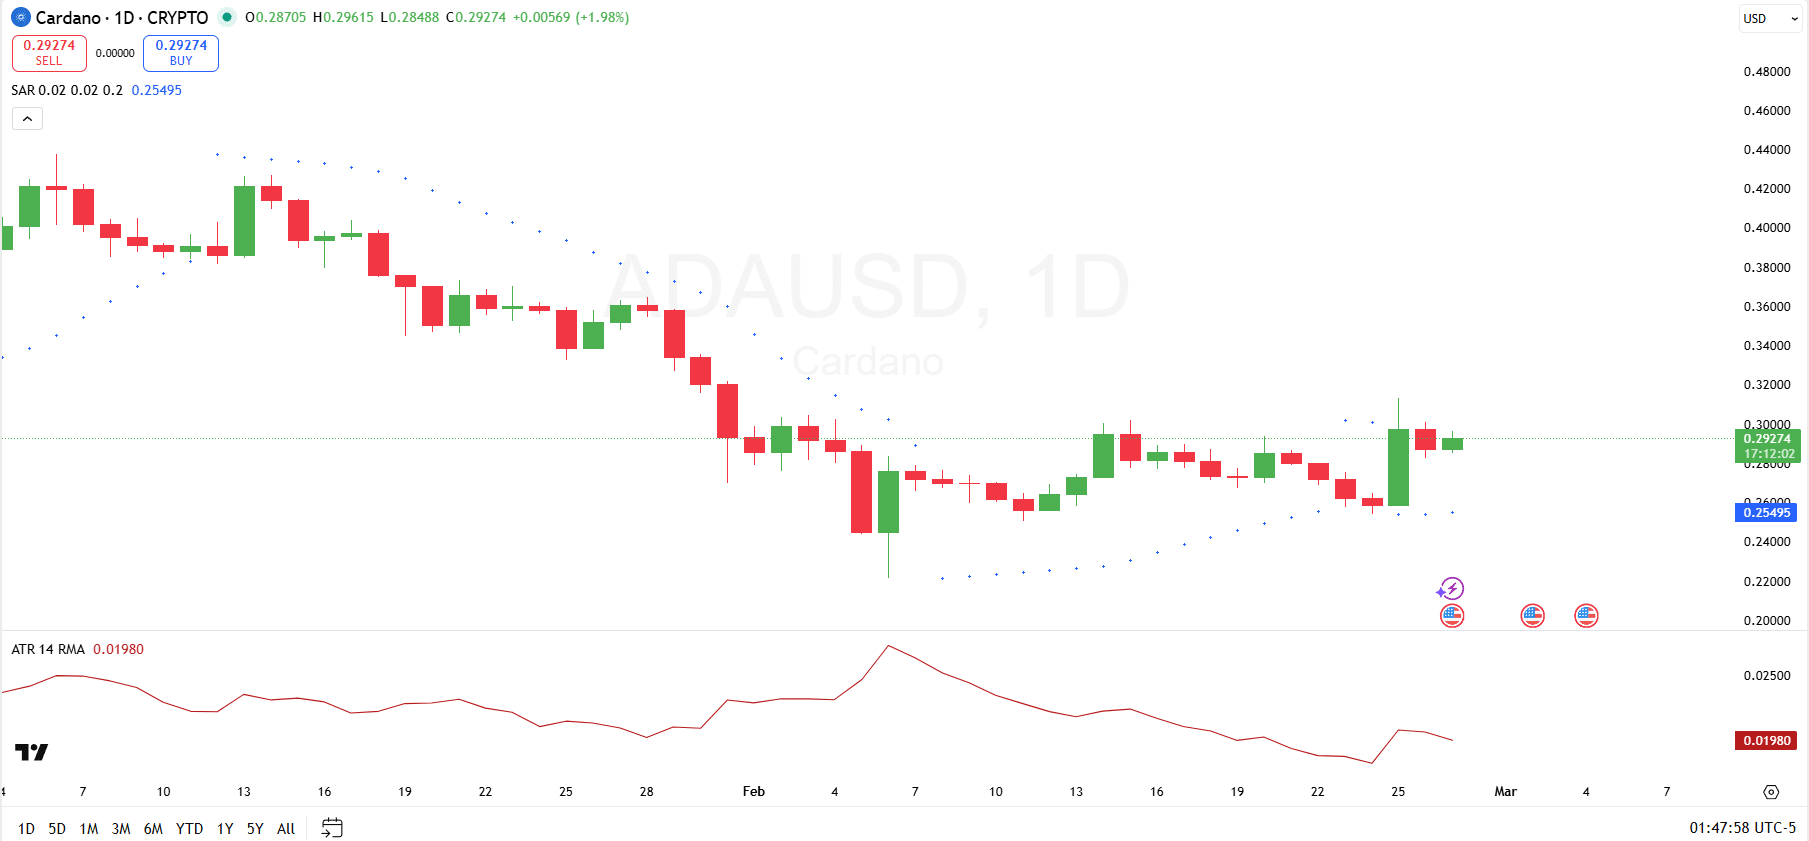
After a prolonged downtrend, $ADA appears to be attempting to establish a base around the mid-$0.26 to $0.29 region. A sustained hold above the SAR level would reinforce the developing bullish structure, while a break back below it could invalidate the early reversal signal.
Meanwhile, the Average True Range sits around 0.0198, indicating that volatility has moderated compared to the sharp swings seen earlier in the decline. The cooling ATR suggests price is stabilizing rather than expanding aggressively in either direction. Combined with the SAR flip, this contraction in volatility may precede a more decisive move.
Cardano OI-Weighted Funding Rate
The Cardano OI-weighted funding rate chart (30-minute timeframe) shows a highly volatile derivatives landscape over the past two weeks. Funding rates have oscillated sharply between positive and negative territory, with multiple deep red spikes below -0.0100% around February 16 and February 21–22, indicating aggressive short positioning during periods of price weakness.
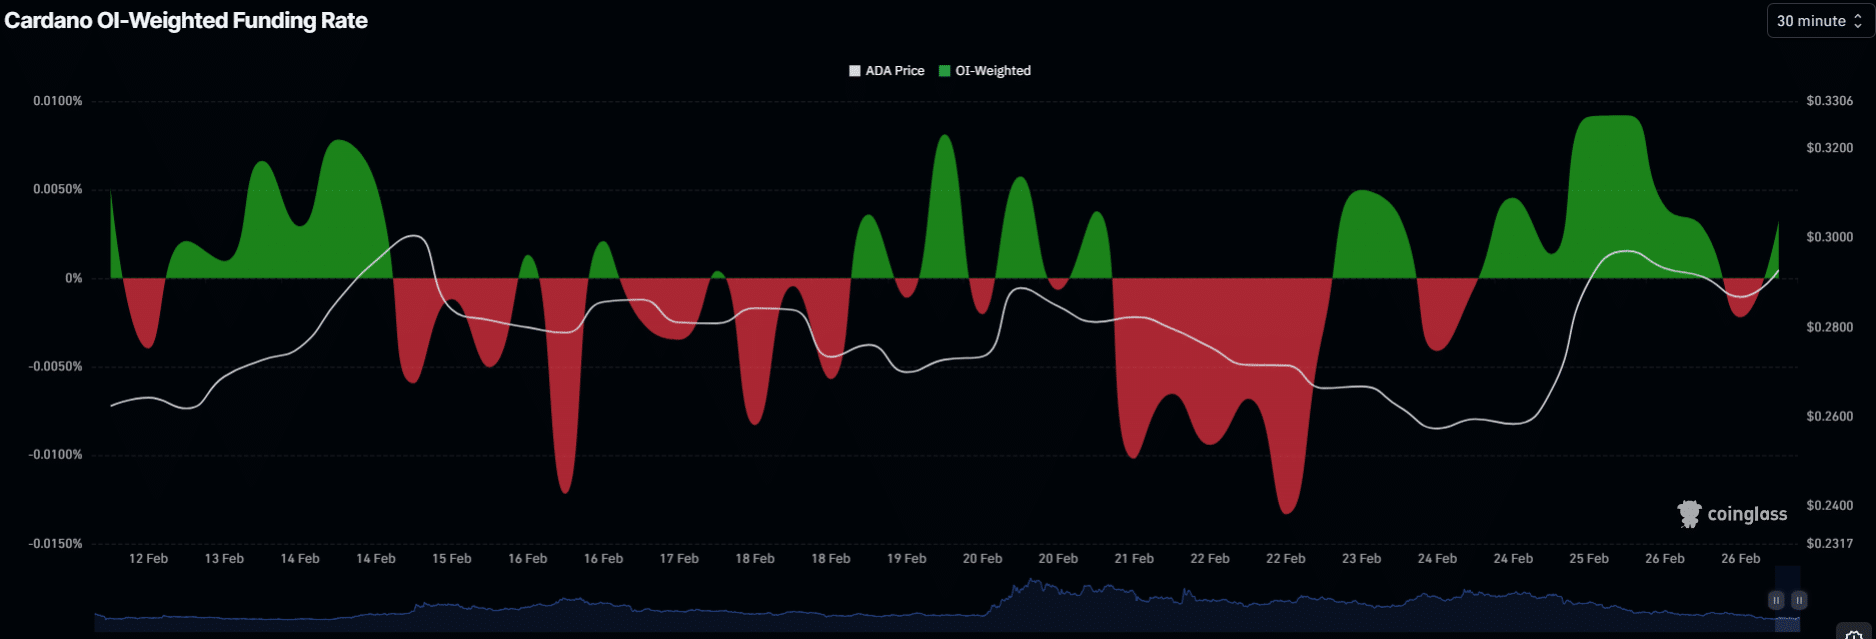
These negative funding extremes coincided with declines in $ADA’s price toward the $0.26 region, suggesting traders were heavily betting on further downside. Historically, such deeply negative funding levels often signal crowded short trades, creating conditions for short squeezes if the price begins to rebound.
More recently, funding has flipped decisively positive, with green spikes approaching +0.0100%. If funding remains elevated while price stalls, it could signal overheating long positioning. Conversely, a sustained positive funding environment alongside rising prices would confirm strengthening upside momentum.