Cardano is developing well within an accumulation phase on higher timeframes, mirroring a familiar pattern that previously preceded an explosive move.
Notably, this pattern emerged in previous cycles, where Cardano ($ADA) consolidated for a while within a “correction” zone after prior highs, cooling sentiments, and flushing out weak hands. Historically, what follows this is an expansion to unprecedented prices.
Key Points
- Cardano is developing well within an accumulation phase on higher timeframes, mirroring a familiar pattern that preceded an explosive move.
- Cardano has spent years moving sideways in a broad corrective range, spanning from its 2021 all-time high of $3.10 to date.
- On the monthly timeframe, the asset appears to be stabilizing near the lower boundary of the multi-year range.
- Historically, similar behavior has marked the late stages of corrective cycles.
- If the current momentum sustains, the “pump phase” could be on the horizon, potentially taking $ADA past $7.
Cardano Multi-Year Correction Phase
A recent commentary from well-known market analyst Bitcoinsensus shows that Cardano has spent years moving sideways in a broad corrective range. This phase, which started after its September 2021 all-time high of $3.10, has seen $ADA fall into a range and consolidate there, losing 90% of its price.
While some have focused on the bearish short-term swings, the analysis highlighted that Cardano’s longer-term structure is telling a story that resembles the early stages of previous expansion phases.
On the monthly timeframe, the asset appears to be stabilizing near the lower boundary of the multi-year range. After a prolonged decline from its prior highs, the recent reaction from this support zone has raised optimism that Cardano is nearing a structural turning point.
Multi-Year Correction Nears Exhaustion
The accompanying chart shows that Cardano entered this lengthy correction phase after its last “pump phase.” That parabolic expansion carried $ADA from its March 2020 lows of $0.0177 to its $3.10 all-time high before the consolidation inside a wide horizontal band started.
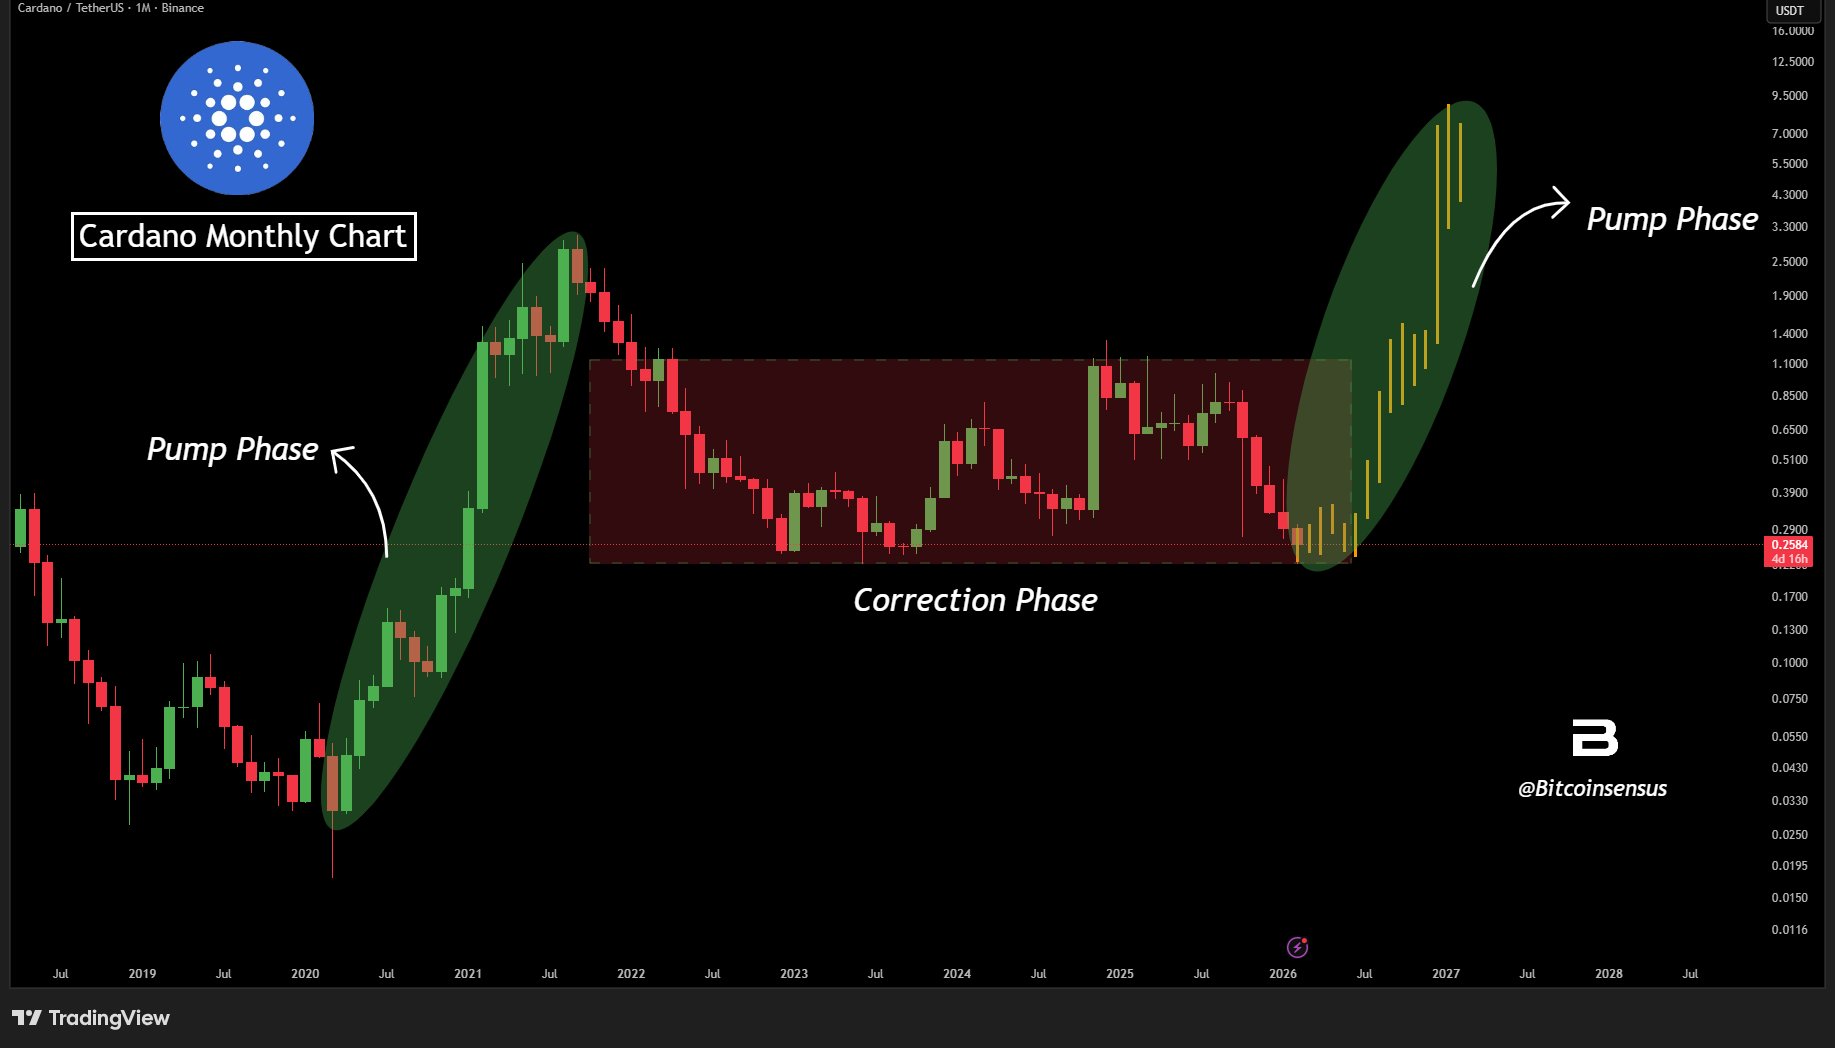
Recently, $ADA returned to the bottom of that range, falling to $0.220 on February 6. Instead of breaking down, the asset held its ground around this key support area, suggesting that selling pressure may be fading.
At the time of writing, Cardano trades at $0.297, reflecting a 35% bounce from the range’s bottom. As things stand, the coin has turned green on the monthly chart and is on course for its first positive monthly close in six months.
Historically, similar behavior has marked the late stages of corrective cycles. Additionally, early signs of higher-timeframe momentum have emerged, supporting the rebound narrative.
Cardano Target in the Pump Phase
Looking back, Cardano’s previous cycle followed a familiar pattern of a long base, a decisive breakout, and then the pump phase. The current setup mirrors that pattern, as $ADA now sits at what the analyst considers a “transition zone” between accumulation and expansion.
If the current momentum sustains, the “pump phase” could be on the horizon. Based on the projected path highlighted in the chart, this expansion period could carry Cardano well beyond its former highs, to levels above $7. From here, it represents an over 2,257% rally.
Notably, such targets require a massive price shift and would depend largely on broader market conditions and sustained demand. Even with these, there is still no guarantee that Cardano will reach that height.